Fig. 3
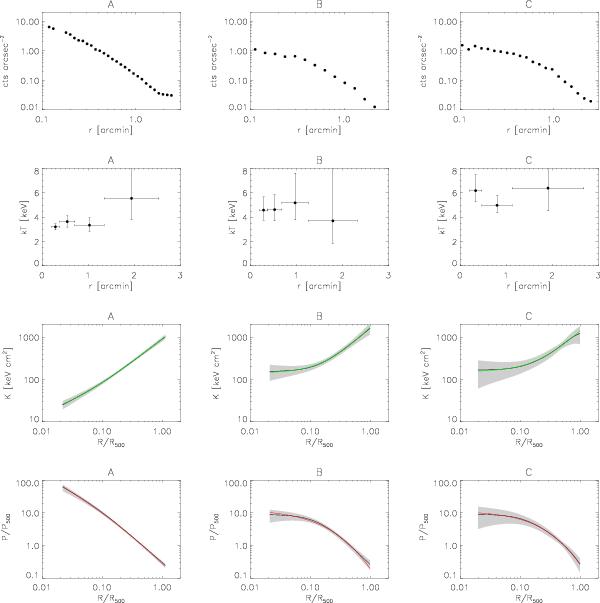
Radial profiles for the relevant X-ray quantities for each component. From top to bottom: surface brightness in the energy band 0.5–2.5 keV, projected temperature, three-dimensional entropy and pressure both as a function of the projected distance from the ce (rescaled by the value at R500) The first two quantities are functions of the projected distance from the centre and the others are functions of the distance from the centre in units of R500 (with the values in Table 1). The black lines in the last two rows are the combination of the density and temperature profiles to estimate entropy and pressure and the shaded areas show the corresponding ± 1σ uncertainty. The red and green lines are our best fit models, with the functions discussed in the text.
Current usage metrics show cumulative count of Article Views (full-text article views including HTML views, PDF and ePub downloads, according to the available data) and Abstracts Views on Vision4Press platform.
Data correspond to usage on the plateform after 2015. The current usage metrics is available 48-96 hours after online publication and is updated daily on week days.
Initial download of the metrics may take a while.