Fig. 11
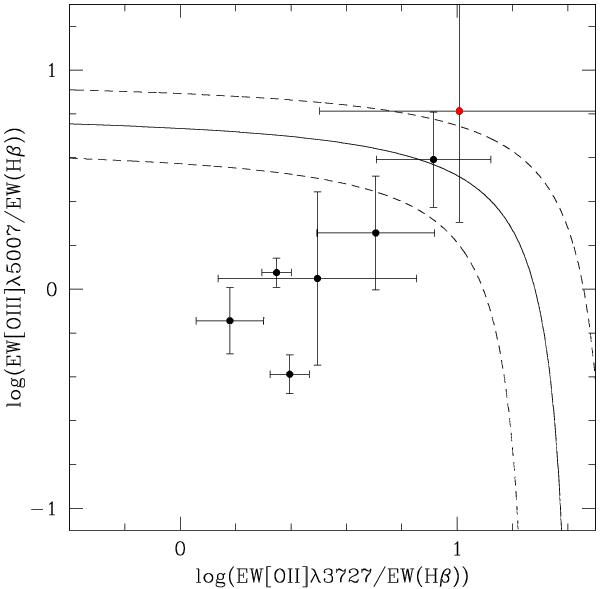
Diagnostic diagram used by Bongiorno et al. (2010) to distinguish between pure star-forming and AGN-contaminated galaxies applied to those galaxies of our sample classified as starburst (3) and lying at redshift 0.6 < z < 0.95 to have their [OIII]λ5007 line falling within the observed wavelength range. The solid and dashed curves show the demarcation and its ± 0.15 dex uncertainty, respectively, between pure star-forming galaxies (bottom region) and AGN (top region), as defined in Lamareille et al. (2004). The red point marks the starburst object possibly hosting an AGN that was therefore excluded from the final stacking procedure.
Current usage metrics show cumulative count of Article Views (full-text article views including HTML views, PDF and ePub downloads, according to the available data) and Abstracts Views on Vision4Press platform.
Data correspond to usage on the plateform after 2015. The current usage metrics is available 48-96 hours after online publication and is updated daily on week days.
Initial download of the metrics may take a while.