Fig. 7
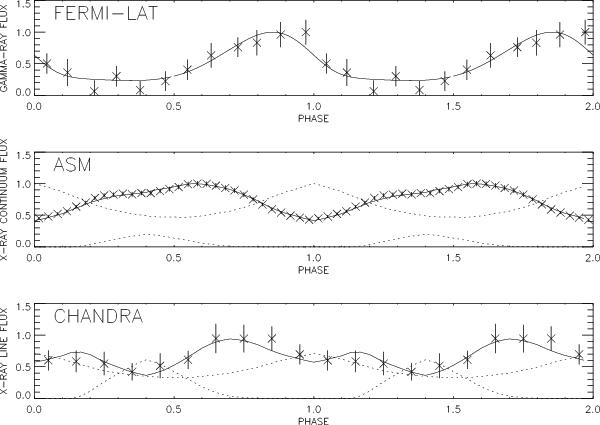
Observed (crosses) and model (solid) light curves for gamma-ray (top, Fermi/LAT), X-ray continuum (middle, ASM daily mean ≥ 15 cps) and mean of SiXIV, FeXXV and FeXXVI emission lines (bottom, Chandra/HETG). The dotted lines in the two lowest panels show the contributing optical depths of the two absorbers (wind and clumpy trail), scaled with the maximum of continuum wind absorption (the same scale on the left as for the light curves).
Current usage metrics show cumulative count of Article Views (full-text article views including HTML views, PDF and ePub downloads, according to the available data) and Abstracts Views on Vision4Press platform.
Data correspond to usage on the plateform after 2015. The current usage metrics is available 48-96 hours after online publication and is updated daily on week days.
Initial download of the metrics may take a while.