Fig. 8
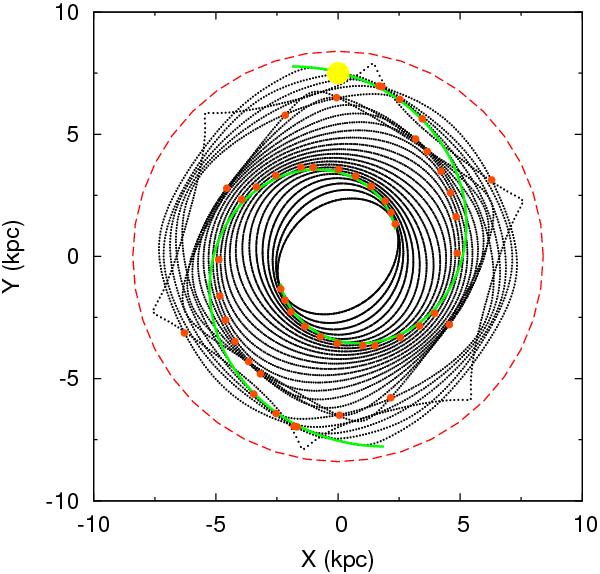
Series of closed orbits in the plane of the Galaxy obtained using the rotation curve of Eq. (17). The spirals indicated in green represent the imposed perturbation; they coincide with the response density (red dots) up to 4:1 resonance. The red circle is the corotation radius (Rcor = 8.4 kpc). The perturbation amplitude is ζ0 = 600 km2 s-2 kpc-1. The yellow dot shows the Sun position.
Current usage metrics show cumulative count of Article Views (full-text article views including HTML views, PDF and ePub downloads, according to the available data) and Abstracts Views on Vision4Press platform.
Data correspond to usage on the plateform after 2015. The current usage metrics is available 48-96 hours after online publication and is updated daily on week days.
Initial download of the metrics may take a while.