Fig. 4
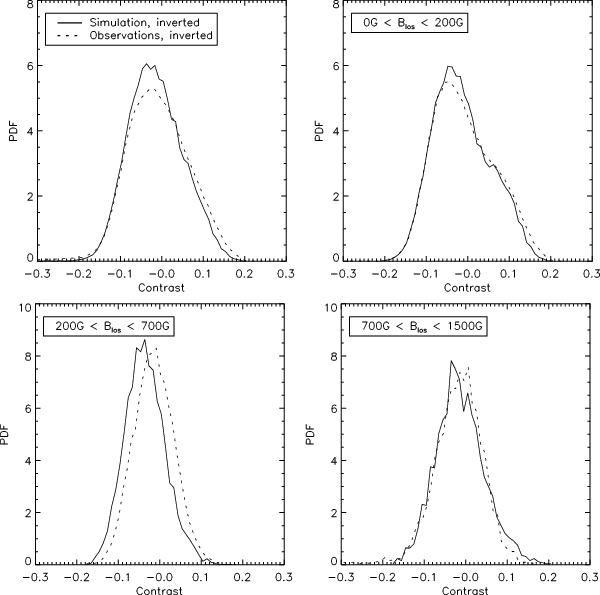
Probability distribution functions (normalized to unit area) of the continuum intensity contrast (bin size 0.01) from MHD simulations (solid curves, corresponding to the green curve in Fig. 3) and observations (dashed curves, corresponding to the red curve in Fig. 3). The upper left panel shows the PDF for all pixels, while the plots in the other panels give the PDFs for various ranges of BLOS (indicated by the insets) obtained from inversions, omitting the pixels corresponding to pores.
Current usage metrics show cumulative count of Article Views (full-text article views including HTML views, PDF and ePub downloads, according to the available data) and Abstracts Views on Vision4Press platform.
Data correspond to usage on the plateform after 2015. The current usage metrics is available 48-96 hours after online publication and is updated daily on week days.
Initial download of the metrics may take a while.