Fig. 3
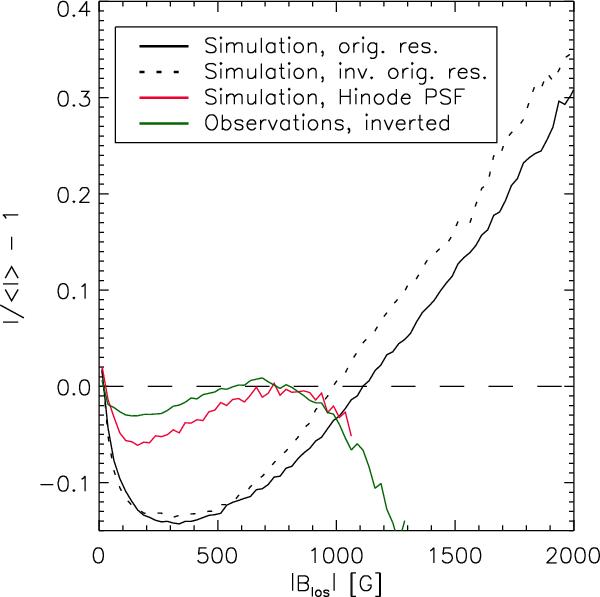
Bin-averaged continuum intensity contrast near 630 nm vs. magnetic field strength. The bin size is 25 G. Shown are observational Hinode/SP data (red curve), simulation data (intrinsic vertical field) at original resolution (solid black curve, values taken at optical depth 0.1), inverted apparent magnetic field at original simulation resolution (dashed black curve), and synthetic Hinode/SP observations derived from the simulations (green curve). The shift between the solid and dashed black curves (the inverted field being somewhat weaker than the original field for the same contrast value) indicates that the inversion effectively samples the magnetic field at a level somewhat above the surface of optical depth 0.1.
Current usage metrics show cumulative count of Article Views (full-text article views including HTML views, PDF and ePub downloads, according to the available data) and Abstracts Views on Vision4Press platform.
Data correspond to usage on the plateform after 2015. The current usage metrics is available 48-96 hours after online publication and is updated daily on week days.
Initial download of the metrics may take a while.