Free Access
Fig. 2
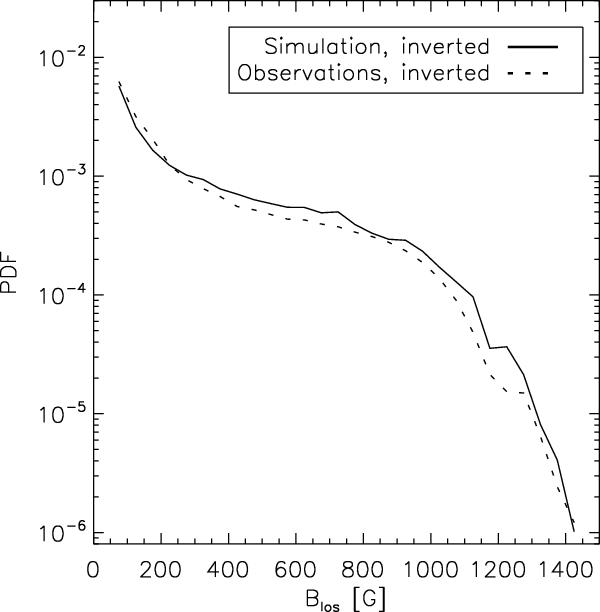
Probability distribution functions (normalized to unit area) of apparent vertical field, BLOS (>50 G; bin size 50 G), resulting from the inversion procedure (after removal of the pores). The solid curve corresponds to the MHD simulations, the dashed curve to the Hinode/SP observations.
Current usage metrics show cumulative count of Article Views (full-text article views including HTML views, PDF and ePub downloads, according to the available data) and Abstracts Views on Vision4Press platform.
Data correspond to usage on the plateform after 2015. The current usage metrics is available 48-96 hours after online publication and is updated daily on week days.
Initial download of the metrics may take a while.