Fig. 1
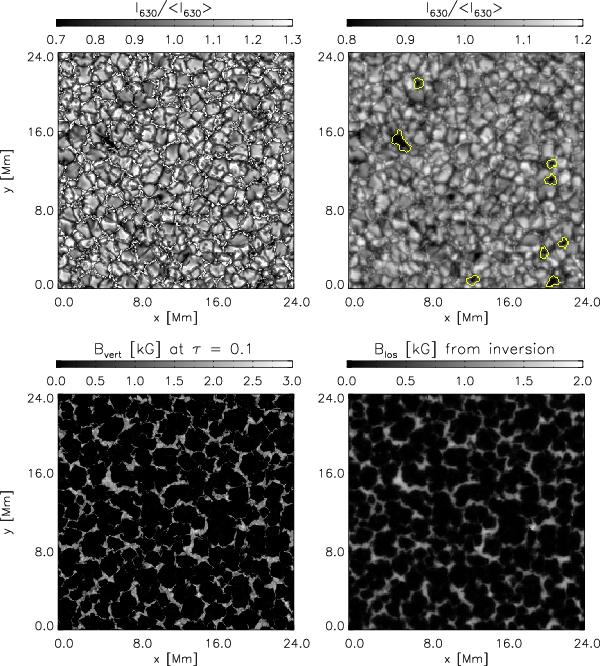
Upper row: maps of the normalized continuum intensity near 630 nm at original resolution of the MHD simulation (left panel) and after convolving with the Hinode/SP PSF and rebinning to SP detector pixels (right panel). Yellow contours outline the areas identified by the pore exclusion procedure. Lower row: maps of the vertical magnetic field component at local optical depth τ630 = 0.1 for original resolution of the simulation (left panel) and of the line-of-sight magnetic field derived from the inversion of synthetic Stokes profiles (right panel).
Current usage metrics show cumulative count of Article Views (full-text article views including HTML views, PDF and ePub downloads, according to the available data) and Abstracts Views on Vision4Press platform.
Data correspond to usage on the plateform after 2015. The current usage metrics is available 48-96 hours after online publication and is updated daily on week days.
Initial download of the metrics may take a while.