Fig. 8
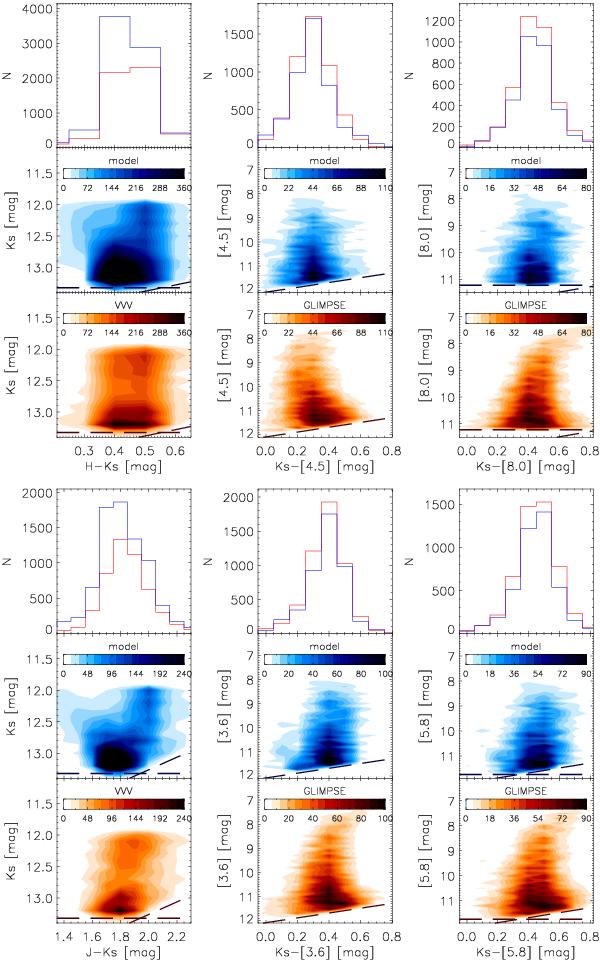
Color–magnitude diagram and color distribution for all colors of the field l = 0.00, b = 1.00. The lower panel shows the observed color–magnitude diagram, the middle panel the synthetic color–magnitude diagram with the best-fitted extinction, and the upper panel shows the histograms in the color distribution. The red color scale (lower panel) shows the observations (noted as “VVV or GLIMPSE” in the title of the inner color bar) while the blue color scale shows the simulated data (noted as “model”). The dashed lines show the completeness limit. The color bar inside the color–magnitude diagram shows the number of stars of each corresponding dataset.
Current usage metrics show cumulative count of Article Views (full-text article views including HTML views, PDF and ePub downloads, according to the available data) and Abstracts Views on Vision4Press platform.
Data correspond to usage on the plateform after 2015. The current usage metrics is available 48-96 hours after online publication and is updated daily on week days.
Initial download of the metrics may take a while.