Free Access
Fig. 7
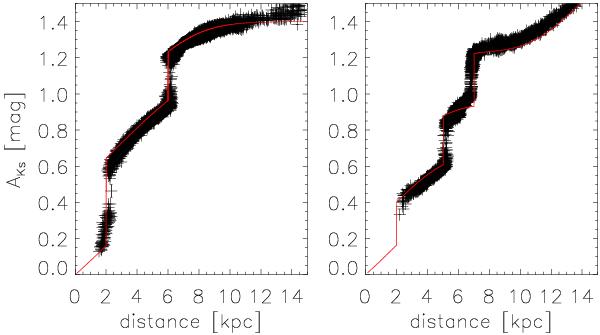
Test of our method. The red line is the artificial extinction with clouds. The black crosses show our derived extinction values. The left panel is of field (l, b) = (0.00, +1.00) and the right of field (l, b) = (5.00, 0.00).
Current usage metrics show cumulative count of Article Views (full-text article views including HTML views, PDF and ePub downloads, according to the available data) and Abstracts Views on Vision4Press platform.
Data correspond to usage on the plateform after 2015. The current usage metrics is available 48-96 hours after online publication and is updated daily on week days.
Initial download of the metrics may take a while.