Fig. 6
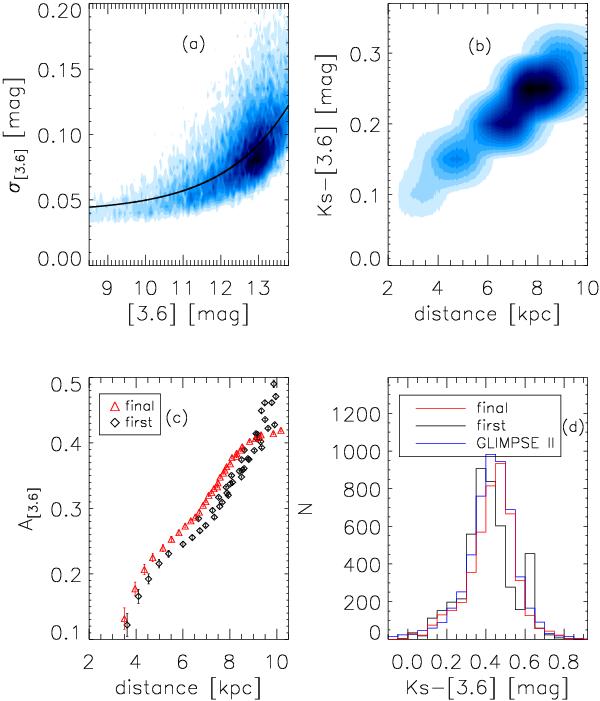
Calculation process for the extinction of the example subfield (l, b) of (0.0, +1.0). From upper left to lower right, they are a) the errors of [3.6] vs. the [3.6] diagram, b) the color Ks–[3.6] vs. distance diagram, c) the extinction at [3.6] vs. the distance diagram where we show the first initial guess of extinction after the first iteration (black) and the final iteration after 20 loops, (red) and d) the color Ks–[3.6] distribution of the data compared to the first guess iteration (black) and the final one (red).
Current usage metrics show cumulative count of Article Views (full-text article views including HTML views, PDF and ePub downloads, according to the available data) and Abstracts Views on Vision4Press platform.
Data correspond to usage on the plateform after 2015. The current usage metrics is available 48-96 hours after online publication and is updated daily on week days.
Initial download of the metrics may take a while.