Fig. 4
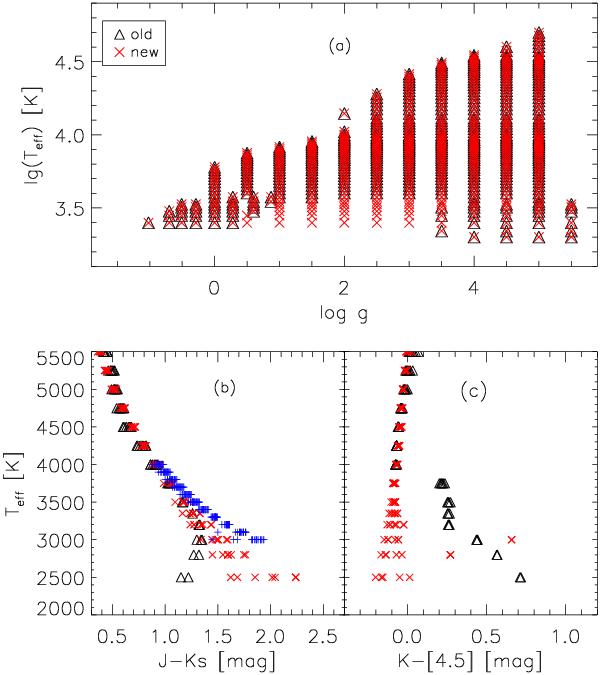
a): log Teff vs. log g grid in the Besançon model. Black triangles indicate the coverage of the Besançon model (Robin et al. 2003) while red stars show the new extended grid. b): J–Ks vs. Teff relation. Black triangles show the old relation and red crosses the new one. The blue symbols is the relation for M giants from Houdashelt et al. (2000). c): Similar as b) but for K–[4.5] vs. Teff.
Current usage metrics show cumulative count of Article Views (full-text article views including HTML views, PDF and ePub downloads, according to the available data) and Abstracts Views on Vision4Press platform.
Data correspond to usage on the plateform after 2015. The current usage metrics is available 48-96 hours after online publication and is updated daily on week days.
Initial download of the metrics may take a while.