Fig. 23
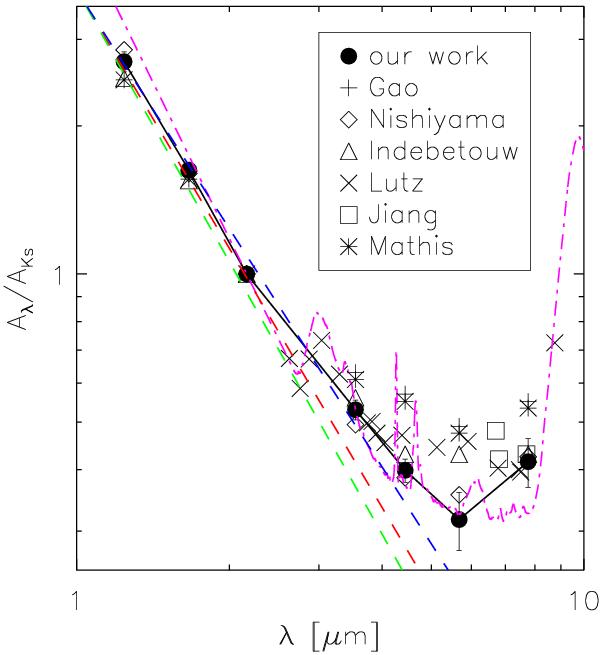
Our derived interstellar extinction curve together with the comparison of different literature work. We used the mean extinction values over all fields. The red dashed line indicates a simple power law Aλ ∝ λ-1.75 from Draine (1989), the blue line the power law of Cardelli et al. (1989) with Aλ ∝ λ-1.61, and the green line depicts the power law of Fitzpatrick & Massa (2009) with Aλ ∝ λ-1.84. The dot-dashed line in magenta shows the extinction curve of Fritz et al. (2011) in the Galactic center.
Current usage metrics show cumulative count of Article Views (full-text article views including HTML views, PDF and ePub downloads, according to the available data) and Abstracts Views on Vision4Press platform.
Data correspond to usage on the plateform after 2015. The current usage metrics is available 48-96 hours after online publication and is updated daily on week days.
Initial download of the metrics may take a while.