Fig. 18
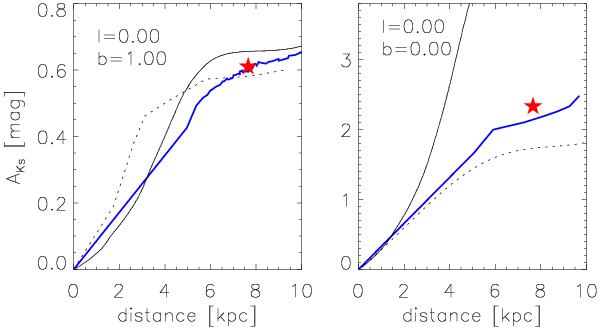
3D extinction comparison with Marshall et al. (2006) and Drimmel et al. (2003), where the black solid line is for Drimmel et al. (2003), the black dashed line for Marshall et al. (2006), and the blue line is the result of our determination. The star symbols denote the calculated distance of the corresponding red-clump position of Gonzalez et al. (2012).
Current usage metrics show cumulative count of Article Views (full-text article views including HTML views, PDF and ePub downloads, according to the available data) and Abstracts Views on Vision4Press platform.
Data correspond to usage on the plateform after 2015. The current usage metrics is available 48-96 hours after online publication and is updated daily on week days.
Initial download of the metrics may take a while.