Fig. 3
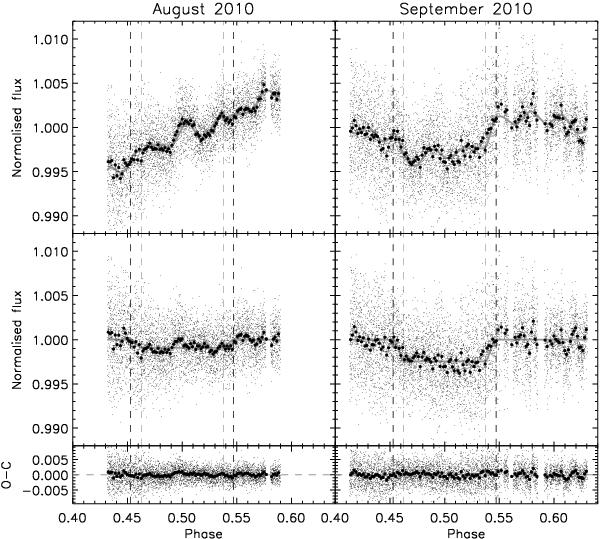
Light curves for the secondary eclipse of WASP-33b for the night I (left panels) and night II (right panels). Top panels: the light curves of WASP-33 normalised with those of the reference star, overplotted is the best fitting “full” model with a low order polynomial baseline correction, stellar pulsations and the eclipse. Middle panels: the light curves corrected for the trends in the baseline and stellar pulsations, clearly showing the transit. Bottom panels: the residuals after subtracting the best-fit model. The thick points with errorbars in these figures show the data binned by 50 points. The vertical dashed lines show the expected times for first to fourth contact.
Current usage metrics show cumulative count of Article Views (full-text article views including HTML views, PDF and ePub downloads, according to the available data) and Abstracts Views on Vision4Press platform.
Data correspond to usage on the plateform after 2015. The current usage metrics is available 48-96 hours after online publication and is updated daily on week days.
Initial download of the metrics may take a while.