Free Access
Fig. 2
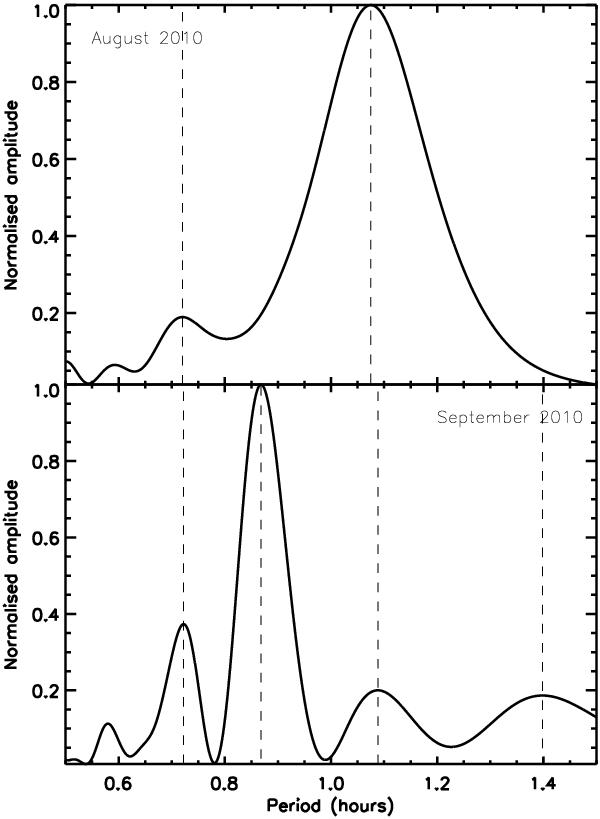
Normalised periodograms of the light curves for the two separate nights. The top panel shows the periodogram for night I and the bottom panel shows the periodogram for night II. The dashed lines in both panels indicate the periods used in the fitting.
Current usage metrics show cumulative count of Article Views (full-text article views including HTML views, PDF and ePub downloads, according to the available data) and Abstracts Views on Vision4Press platform.
Data correspond to usage on the plateform after 2015. The current usage metrics is available 48-96 hours after online publication and is updated daily on week days.
Initial download of the metrics may take a while.