Fig. 1
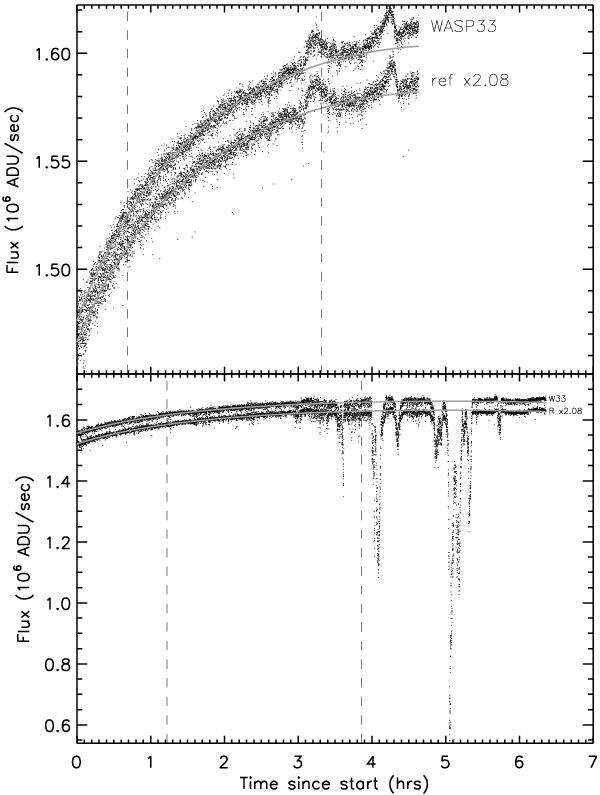
Raw lighcurves for WASP-33 and the reference star (multiplied by 2.08 for plotting purposes) for the night of August 18, 2010 (top panel) and for the night of September 20, 2010 (bottom panel). The vertical dashed lines indicate the expected beginning and end of the targeted eclipse. The solid, grey, lines show the airmass during the nights, scaled to match the stellar flux in the first hour of the observations.
Current usage metrics show cumulative count of Article Views (full-text article views including HTML views, PDF and ePub downloads, according to the available data) and Abstracts Views on Vision4Press platform.
Data correspond to usage on the plateform after 2015. The current usage metrics is available 48-96 hours after online publication and is updated daily on week days.
Initial download of the metrics may take a while.