Fig. 7
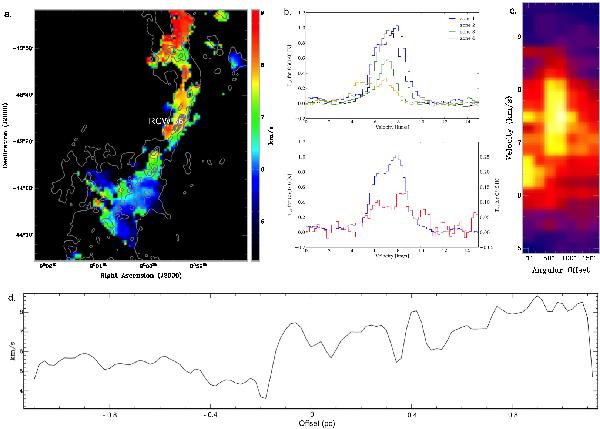
a) CS (1–0) velocity map around RCW 36 in Vela C with column density contours overlaid (levels: 5, 15, 25, 35, and 45% of the 1.8 × 1023 cm-2 column density). b) CS(1−0) integrated spectra around RCW 36. The spectra are spatially integrated in the coloured circles showed in Fig. 2a. CS (blue) and C34S (red) lines towards pillar 1 are presented in the bottom panel. c) Position−velocity diagram for a shell, which is expanding radially beyond the clumps. The diagram is built by taking the mean velocity around a circle for a given radius (the angular offset). Each circle is centred on the star cluster. The colour indicates the line intensity. d) Velocity−position diagramme for the area in Fig. 7a based on the vertical profile of the CS velocity, which is averaged horizontally. 0 offset corresponds to RCW 36.
Current usage metrics show cumulative count of Article Views (full-text article views including HTML views, PDF and ePub downloads, according to the available data) and Abstracts Views on Vision4Press platform.
Data correspond to usage on the plateform after 2015. The current usage metrics is available 48-96 hours after online publication and is updated daily on week days.
Initial download of the metrics may take a while.