Fig. 4
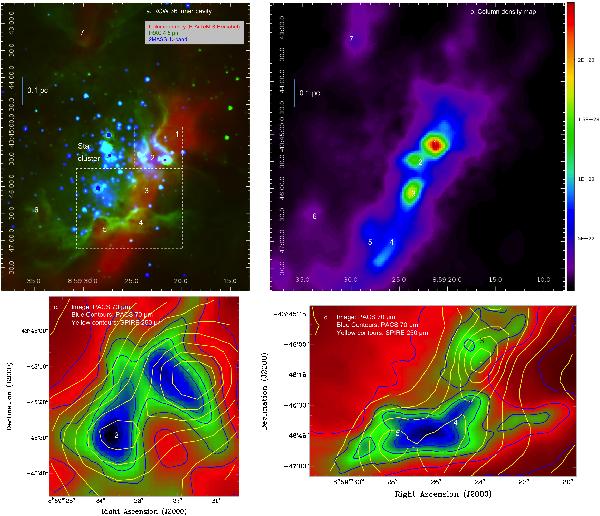
a) Three-colour image of the RCW 36 cavity (see Fig. 1) corresponding to the field mapped by P-ArTéMiS. Red is the column density that is shown for values between 3 × 10²¹ and 5 × 1022 cm-2 to limit the dynamics and emphasize low density features. The peak column density is 1.7 × 1023 cm-2. Green is the IRAC 4.5 μm image that shows structures due to extinction or emission near the star cluster. Blue is the 2MASS K-band image that shows the young stars. The 7 clumps as described in the text are numbered from 1 to 7 on this image. The two rectangular areas in dashed white lines represent the regions mapped in c) and d). b) Column density map combining Herschel and p-ArTéMiS observations. c) PACS 70-μm emission (colour image and blue contours) with SPIRE 250-μm emission overlaid (in yellow) contours (levels: 10, 20, 30, 40, 50, 60, 70, 80, and 90% of 250 Jy beam-1 peak emission) for clumps 1 and 2. d) Same as b) but for clumps 3, 4 and 5. Position offsets between 70 and 250 μm emission are clearly observed.
Current usage metrics show cumulative count of Article Views (full-text article views including HTML views, PDF and ePub downloads, according to the available data) and Abstracts Views on Vision4Press platform.
Data correspond to usage on the plateform after 2015. The current usage metrics is available 48-96 hours after online publication and is updated daily on week days.
Initial download of the metrics may take a while.