Fig. 3
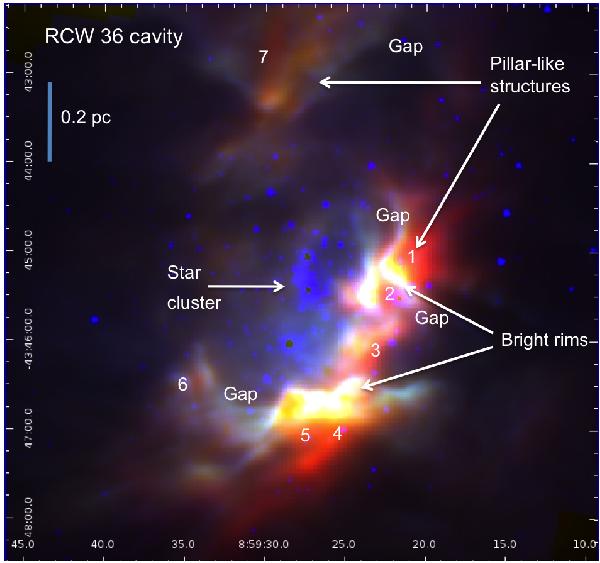
Three-colour image of the RCW 36 sub-area focusing on the inner cavity of the ring-like structure as defined in Fig. 1c. Red is PACS 160 μm emission. Green is PACS 70 μm emission. Blue is IRAC 4.5 μm emission that here shows the star cluster distribution. Bright rims, pillar-like structures and 7 clumps appear prominent as well as large gaps between these structures.
Current usage metrics show cumulative count of Article Views (full-text article views including HTML views, PDF and ePub downloads, according to the available data) and Abstracts Views on Vision4Press platform.
Data correspond to usage on the plateform after 2015. The current usage metrics is available 48-96 hours after online publication and is updated daily on week days.
Initial download of the metrics may take a while.