Fig. 2
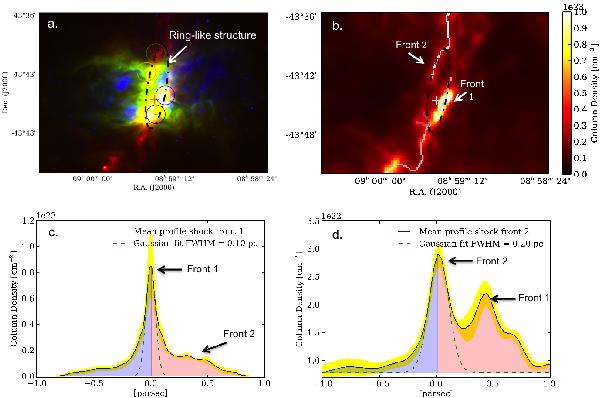
a) Three-colour image of RCW 36 nebula (red: SPIRE 250 μm, green: PACS 70 μm, blue: Hα). The cross indicates the ionizing source. Each coloured circle indicates area for which CS spectra have been integrated as in Fig. 7. The ellipse highlights the ring of compressed gas. b) column density map around RCW 36. The DisPerSe skeleton is drawn in white and each part of the shocked layer is labeled front 1 and front 2. c) Profile of the front 1 traced by DisPerSe on a Herschel+P-ArTéMiS column density map at 12″ resolution. d) Profile of the front 2 traced by DisPerSe on a Herschel column density map at 36′′ resolution. The yellow shaded area represents the standard deviation of the profiles. The green- dashed curve is the Gaussian fit used to determinate the FWHM width.
Current usage metrics show cumulative count of Article Views (full-text article views including HTML views, PDF and ePub downloads, according to the available data) and Abstracts Views on Vision4Press platform.
Data correspond to usage on the plateform after 2015. The current usage metrics is available 48-96 hours after online publication and is updated daily on week days.
Initial download of the metrics may take a while.