Fig. 1
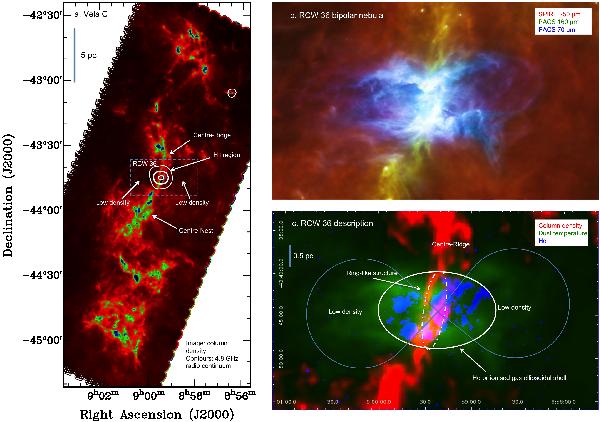
a) Column density map of Vela C derived from Herschel observations at 160, 250, 350 and 500 μm with a resolution of 36″ (see Hill et al. 2011). The peak column density is ~1023 cm-2, although the column density range on this image is 2 × 10²¹–5 × 1022 cm-2 to emphasize both the high density filamentary structure and the more diffuse dust around. The “low density areas” are minima at a few 1021 cm-2 on the East and West sides of the H ii region. The RCW 36 area is indicated by a dashed box. White contours represent the radio continuum emission at 5 GHz. b) Zoom on the RCW 36 bipolar nebula as seen by Herschel at 70, 160 and 250 μm (in blue, green, red, respectively). c) Three-colour image of RCW 36 showing areas with column density from 2 × 10²¹ to 5 × 1022 cm-2 (red), temperature from 14 to 40 K (green) and Hα (blue). Hα emission is within a white ellipse, with a major axis oriented East-West. The column density exhibits a ring-like structure (white dashed-dotted ellipse), that is part of the Centre-Ridge. The hourglass or bipolar shape is suggested with a bi-lobed curve shown in blue.
Current usage metrics show cumulative count of Article Views (full-text article views including HTML views, PDF and ePub downloads, according to the available data) and Abstracts Views on Vision4Press platform.
Data correspond to usage on the plateform after 2015. The current usage metrics is available 48-96 hours after online publication and is updated daily on week days.
Initial download of the metrics may take a while.