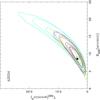
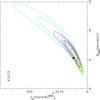
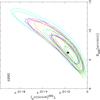
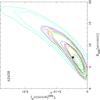
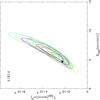
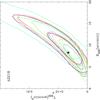
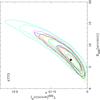
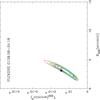
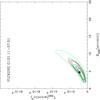
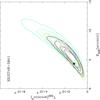
Fig.8
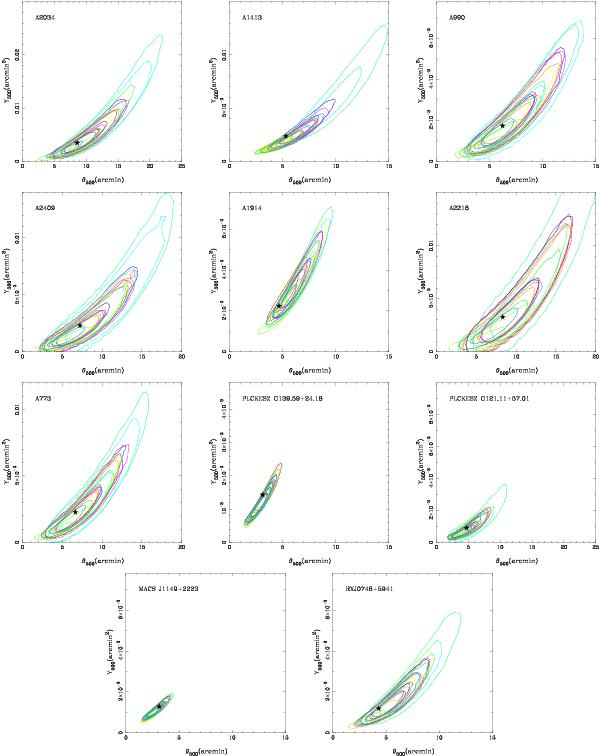
Recovery of SZ cluster parameters from the simulated AMI observations in the presence of residual point source contamination from imperfectly modeled radio sources for each cluster in the sample. Also included in the simulations are the AMI uv coverage, the instrument beams and realisations of the instrument noise and primordial CMB. The different sets of contours indicate different CMB and noise realisations and the star shows the input parameters used to generate the simulated cluster. The inner and outer contours in each set indicate the areas enclosing 68% and 95% of the probability distribution.

Current usage metrics show cumulative count of Article Views (full-text article views including HTML views, PDF and ePub downloads, according to the available data) and Abstracts Views on Vision4Press platform.
Data correspond to usage on the plateform after 2015. The current usage metrics is available 48-96 hours after online publication and is updated daily on week days.
Initial download of the metrics may take a while.