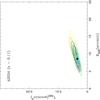
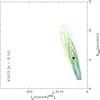
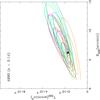
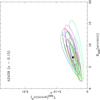
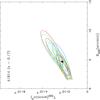
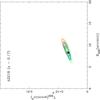
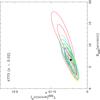
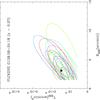
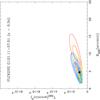
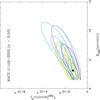
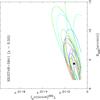
Fig.7
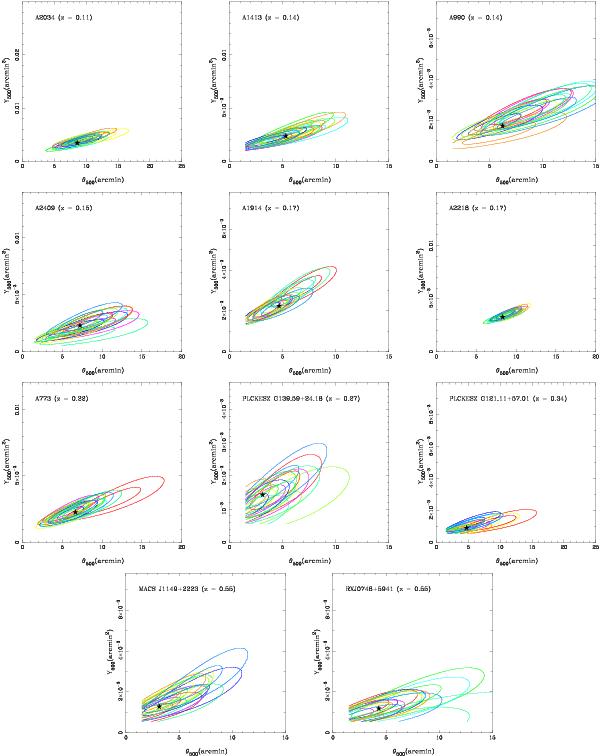
Recovery of SZ cluster parameters from simulated Planck observations (see Sect. 6.1 for details). Each set of recovered parameter constraints (contours with different colours) represents a different realisation of the instrument noise and primordial CMB fluctuations and the star shows the input parameter values. The inner and outer contours in each set indicate the areas enclosing 68% and 95% of the probability distribution. Any bias in the recovery of the input parameters averaged over realisations is negligible compared to the random errors. In cases where the contours do not close at the lower ends of the parameter ranges, the corresponding constraints represent upper limits only.
Current usage metrics show cumulative count of Article Views (full-text article views including HTML views, PDF and ePub downloads, according to the available data) and Abstracts Views on Vision4Press platform.
Data correspond to usage on the plateform after 2015. The current usage metrics is available 48-96 hours after online publication and is updated daily on week days.
Initial download of the metrics may take a while.