Fig.6
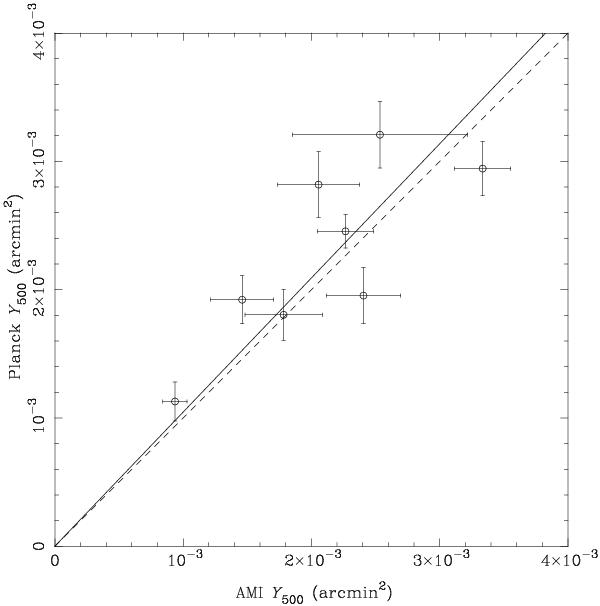
Comparison of the integrated Compton-Y parameters obtained from the Planck and AMI fits, when the cluster size is fixed to that determined from X-ray observations. The one-to-one relation is denoted with the dashed line. The best-fitting linear relation is plotted as the unbroken line. The slope of this latter relation is 1.05 ± 0.05 and the correlation coefficient is 0.80. Note that the same general behaviour (slope >1) is also observed when we fix the cluster size to be that determined from either the Planck or the AMI SZ observations.
Current usage metrics show cumulative count of Article Views (full-text article views including HTML views, PDF and ePub downloads, according to the available data) and Abstracts Views on Vision4Press platform.
Data correspond to usage on the plateform after 2015. The current usage metrics is available 48-96 hours after online publication and is updated daily on week days.
Initial download of the metrics may take a while.