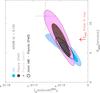
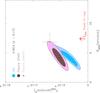
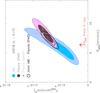
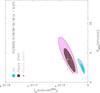
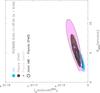
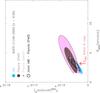
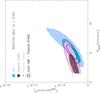
Fig.5
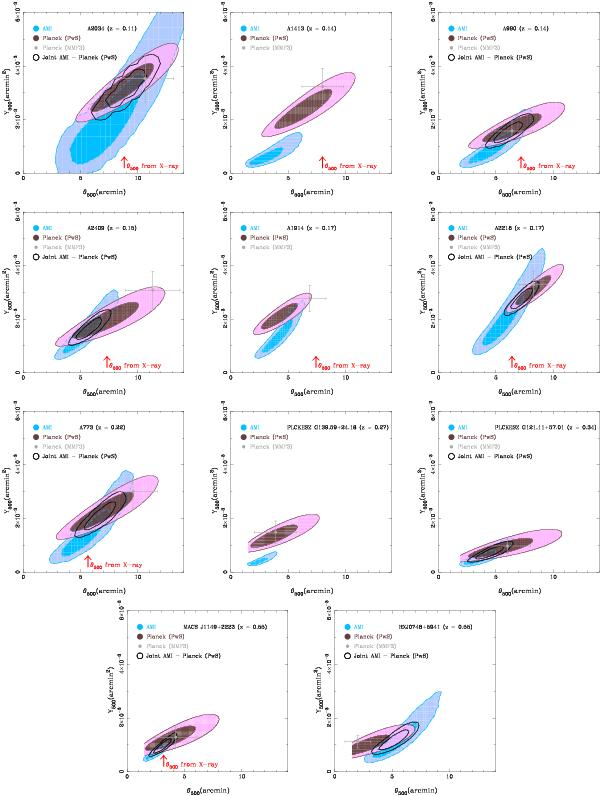
Recovered Planck and AMI 2D posterior distributions in the Y500 − θ500 plane. Blue contour plots are the results from the AMI analysis and purple contours show the Planck results (specifically using the PwS method). Red arrows show the values of θ500 as determined from X-ray measurements of these clusters where available. The grey points with error bars show the MMF3 Planck results. The inner and outer contours in each set indicate the areas enclosing 68% and 95% of the probability distribution, while the MMF3 error-bars indicate the 1σ uncertainties. Where the recovered AMI and PwS Planck constraints are consistent, the joint constraints are also indicated by the heavy black contours. In cases where the contours do not close at the lower ends of the parameter ranges, the corresponding constraints represent upper limits only.

Current usage metrics show cumulative count of Article Views (full-text article views including HTML views, PDF and ePub downloads, according to the available data) and Abstracts Views on Vision4Press platform.
Data correspond to usage on the plateform after 2015. The current usage metrics is available 48-96 hours after online publication and is updated daily on week days.
Initial download of the metrics may take a while.