Free Access
Fig.2
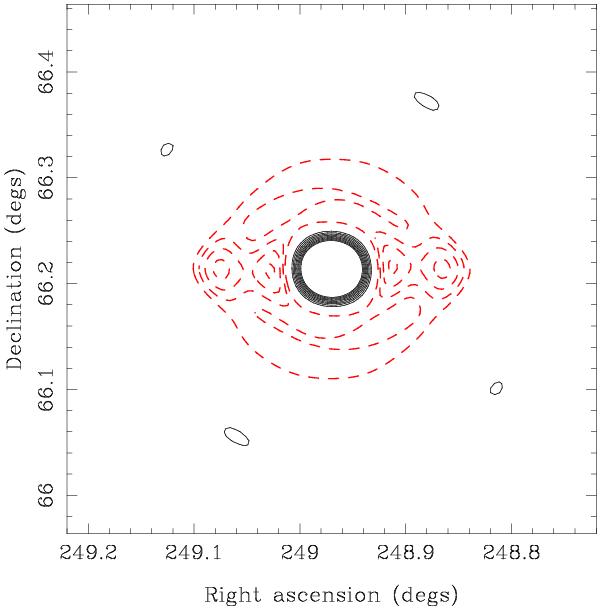
SA synthesised beam for the A2218 observations. Contours start at 6% and increase linearly by 3% per contour. Contours drawn as red dashed lines are negative. The synthesised beams for the other cluster observations are qualitatively similar.
Current usage metrics show cumulative count of Article Views (full-text article views including HTML views, PDF and ePub downloads, according to the available data) and Abstracts Views on Vision4Press platform.
Data correspond to usage on the plateform after 2015. The current usage metrics is available 48-96 hours after online publication and is updated daily on week days.
Initial download of the metrics may take a while.