Fig. 2
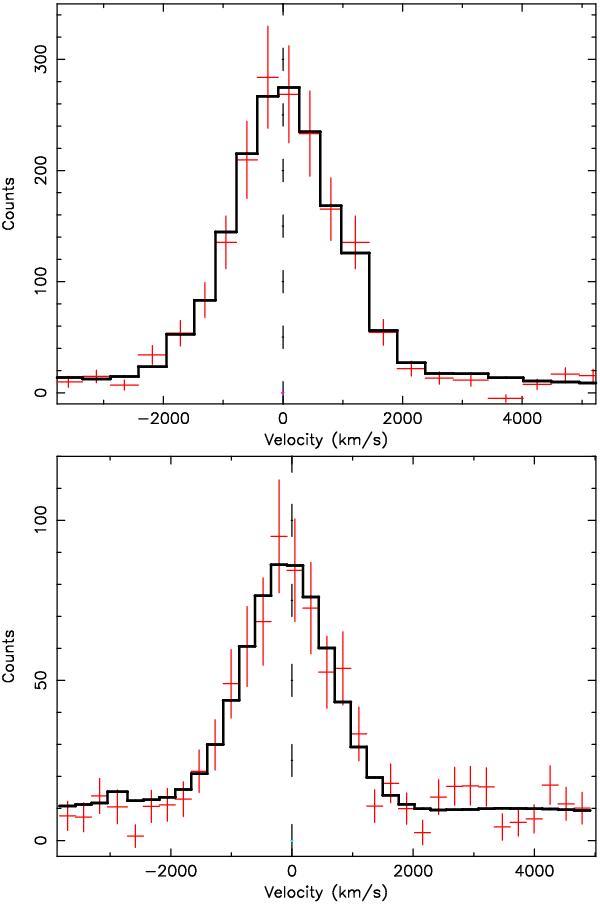
Line shapes of the O viii line at 18.97 Å (top panel) and the C vi line at 33.74 Å in the spectrum of δ Ori. Data are in red/gray, the fitted Gaussian model line folded through the response matrix is given in black. The rest wavelength is also shown. Keep in mind that the width is also influenced by the instrumental line spread function.
Current usage metrics show cumulative count of Article Views (full-text article views including HTML views, PDF and ePub downloads, according to the available data) and Abstracts Views on Vision4Press platform.
Data correspond to usage on the plateform after 2015. The current usage metrics is available 48-96 hours after online publication and is updated daily on week days.
Initial download of the metrics may take a while.