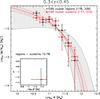
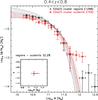
Fig. 4

Observed mass functions and corresponding Schechter function fits for galaxies at different clustercentric distances (R/R200 ≤ 1 and R/R200 > 1) for the ICBS survey (left panel) and EDisCS (right panel). Black crosses and solid lines represent cluster regions, and red empty stars and dotted lines the cluster outskirts. Mass function normalisations, errorbars, labels and in-sets are as in Fig. 2. In both panels, no statistical differences are detected between the mass functions of galaxies located at different clustercentric distances.
Current usage metrics show cumulative count of Article Views (full-text article views including HTML views, PDF and ePub downloads, according to the available data) and Abstracts Views on Vision4Press platform.
Data correspond to usage on the plateform after 2015. The current usage metrics is available 48-96 hours after online publication and is updated daily on week days.
Initial download of the metrics may take a while.