Fig. A.1
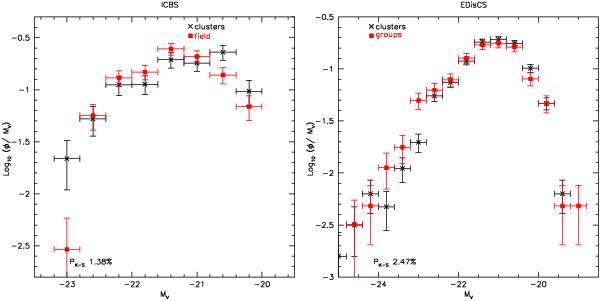
Luminosity functions in different environments. Left panel: ICBS cluster regions (black crosses) and field (red filled squares). Right panel: EDisCS clusters (black crosses) and groups (red filled squares). In each panel, luminosity functions are normalised using the total integrated luminosity. At the bottom of each panel, the K–S probabilities are given. Significant differences are evident between the luminosity functions in different environments.
Current usage metrics show cumulative count of Article Views (full-text article views including HTML views, PDF and ePub downloads, according to the available data) and Abstracts Views on Vision4Press platform.
Data correspond to usage on the plateform after 2015. The current usage metrics is available 48-96 hours after online publication and is updated daily on week days.
Initial download of the metrics may take a while.