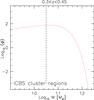
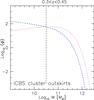
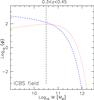
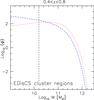
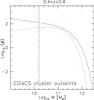
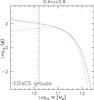
Fig. 11

Schechter fits for the blue (blue dotted lines) and red (red dashed lines) galaxies in the ICBS (upper panels) and EDisCS (lower panels) samples in clusters (left panels), the outskirts (central panels) and groups (right panel for EDisCS) and the field (right panel for ICBS). Black vertical dashed lines represent the range in stellar mass probed by these surveys. The curves are not normalised. The blue ICBS cluster mass function is omitted due to poor number statistics.
Current usage metrics show cumulative count of Article Views (full-text article views including HTML views, PDF and ePub downloads, according to the available data) and Abstracts Views on Vision4Press platform.
Data correspond to usage on the plateform after 2015. The current usage metrics is available 48-96 hours after online publication and is updated daily on week days.
Initial download of the metrics may take a while.