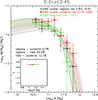
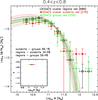
Fig. 10

Observed mass function and Schechter function fits for red galaxies in different environments for the ICBS (left panel) and EDisCS (right panel) samples. Black crosses and solid lines represent the cluster regions, red filled squares and dotted lines the cluster outskirts, and green empty triangles and dashed lines the groups. Mass function normalisations, errorbars, labels and in-sets as in Fig. 2. In the in-sets, errorbars represent the 1σ (solid line) and 2σ (dotted line) errors. For red galaxies, no differences can be detected between the mass functions of galaxies located in clusters, groups, and in the field.
Current usage metrics show cumulative count of Article Views (full-text article views including HTML views, PDF and ePub downloads, according to the available data) and Abstracts Views on Vision4Press platform.
Data correspond to usage on the plateform after 2015. The current usage metrics is available 48-96 hours after online publication and is updated daily on week days.
Initial download of the metrics may take a while.