Fig. 2
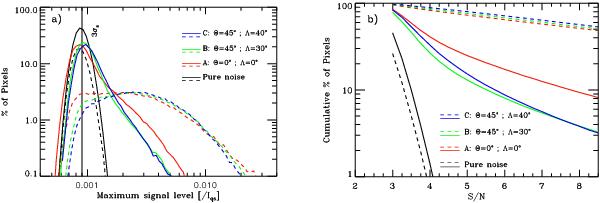
Left panel: histogram of the number of pixels as a function of the maximum value in their polarization signals (normalized to the average continuum intensity). The vertical solid-black line represents the 3σ-level. Right panel: histogram of pixels with polarization signals above a certain S/N. This last histogram is cumulative, while the first one is not. In both panels the color lines indicate the same: red (map A at Λ = 0°), green (map B at Λ = 30°), blue (map C at Λ = 40°). The solid lines refer to the linear polarization profiles (Stokes Q and U) while the dashed lines correspond to the circular polarization profiles (Stokes V). For comparison we also display, in solid and dashed-black curves, the expected behavior due to noise.
Current usage metrics show cumulative count of Article Views (full-text article views including HTML views, PDF and ePub downloads, according to the available data) and Abstracts Views on Vision4Press platform.
Data correspond to usage on the plateform after 2015. The current usage metrics is available 48-96 hours after online publication and is updated daily on week days.
Initial download of the metrics may take a while.