Fig. 12
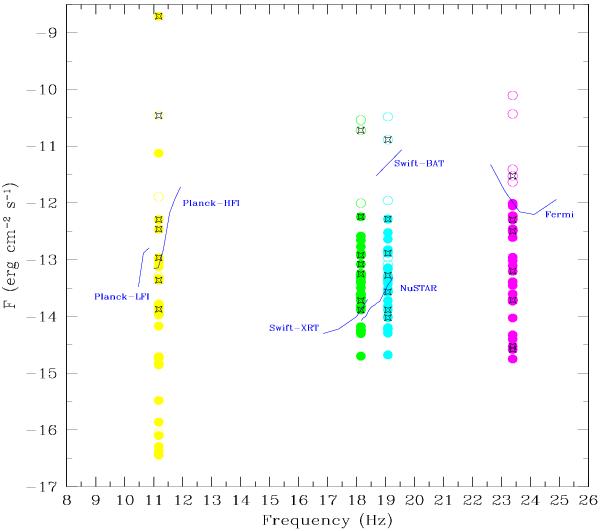
ICS flux predicted for the 21 RG lobes in Table 1 in the SXR, HXR, and gamma-ray bands is compared to the instrumental sensitivity of Swift-XRT, Swift-BAT, and Fermi-LAT. Open dot mark the RG lobes with FICS(1 GeV) larger than the Fermi-LAT sensitivity. The black diamonds mark the seven RGs for which we perform a detailed study. We plot the gamma-ray flux at 1 GeV and the X-ray flux at the centers of the 2−10 keV and 20−80 keV energy bands. The SZE flux is calculated at 150 GHz.
Current usage metrics show cumulative count of Article Views (full-text article views including HTML views, PDF and ePub downloads, according to the available data) and Abstracts Views on Vision4Press platform.
Data correspond to usage on the plateform after 2015. The current usage metrics is available 48-96 hours after online publication and is updated daily on week days.
Initial download of the metrics may take a while.