Fig. 1
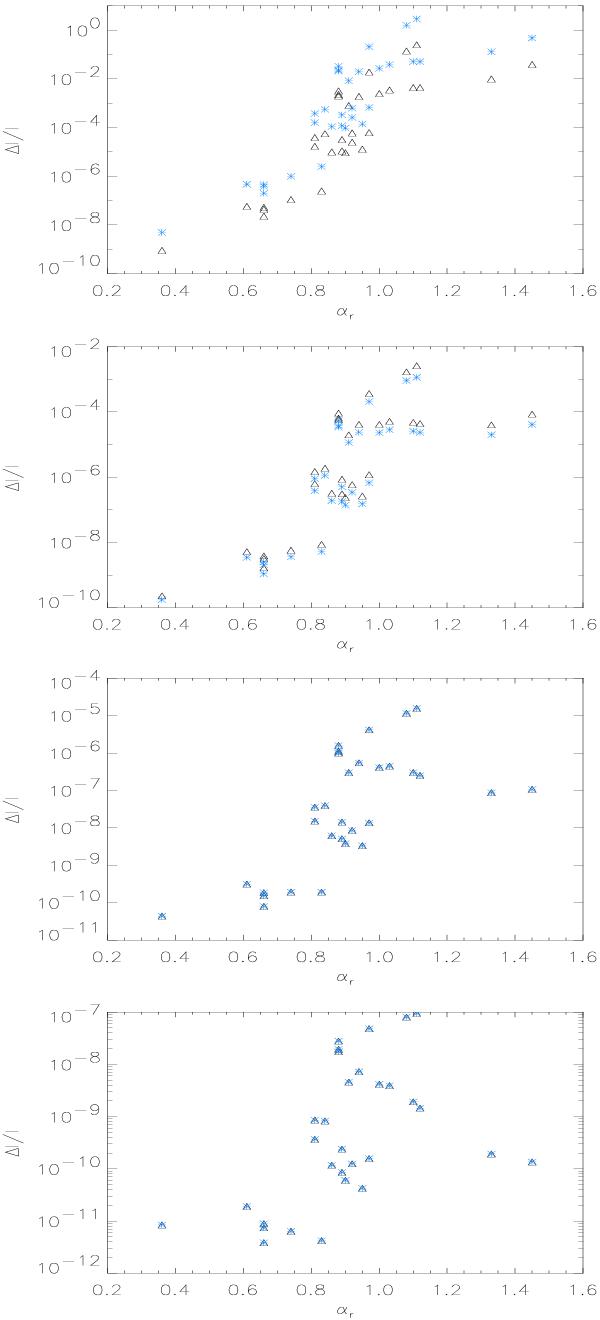
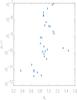
SZE brightness change ΔI/I is shown as a function of the observed radio spectral index αr for the RG lobes in Table 1. The various panels refer to the cases p = 1,10,100,1000 from top down. Black triangles refer to SZE decrement at 150 GHz (in modulus) while the blue asterisks refer to the SZE increment at 500 GHz for p1 = 1 and to the SZE decrement at 500 GHz (in modulus) for p1 = 10, 100, and 1000. The SZE signals in Table 1 are all evaluated for a fixed value of the RG lobe magnetic field (B = 1 μG uniform in the emission region for all the objects considered).
Current usage metrics show cumulative count of Article Views (full-text article views including HTML views, PDF and ePub downloads, according to the available data) and Abstracts Views on Vision4Press platform.
Data correspond to usage on the plateform after 2015. The current usage metrics is available 48-96 hours after online publication and is updated daily on week days.
Initial download of the metrics may take a while.