Fig. A.1
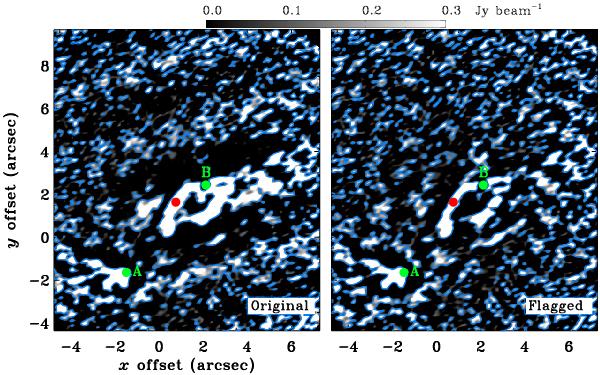
Channel maps at −3 km s-1 before and after additional flagging (see
text). The offsets are as in Fig. 1. The
color scale ranges from 0 to 0.3 Jy beam-1
(0 to ~3σ) and has been chosen to highlight the striping
present in the left map (original data) but not the right (flagged data). The blue
contours are at 1σ in this 0.25 km s-1 channel. The
red dot at (0 75, 165)
shows the position where the spectrum in Fig. A.2 was extracted. Sources A and B are marked in green.
75, 165)
shows the position where the spectrum in Fig. A.2 was extracted. Sources A and B are marked in green.
Current usage metrics show cumulative count of Article Views (full-text article views including HTML views, PDF and ePub downloads, according to the available data) and Abstracts Views on Vision4Press platform.
Data correspond to usage on the plateform after 2015. The current usage metrics is available 48-96 hours after online publication and is updated daily on week days.
Initial download of the metrics may take a while.