Fig. 4
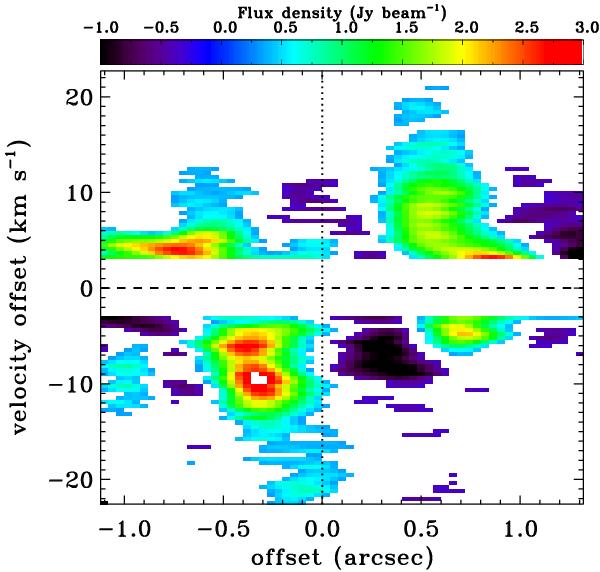
Position-velocity diagram of a slice running at a position angle of 128°
and with a width of 1 25
covering the central part of the outflow centred on source A1. The velocity has been
shifted so the source velocity is at 0 km s-1 (black line). Signal below
the 3σ level is ignored as are the central ± 3 km s-1.
The position of source A1 is marked with a dotted line. Negative offsets are towards
the SE, positive towards NW.
25
covering the central part of the outflow centred on source A1. The velocity has been
shifted so the source velocity is at 0 km s-1 (black line). Signal below
the 3σ level is ignored as are the central ± 3 km s-1.
The position of source A1 is marked with a dotted line. Negative offsets are towards
the SE, positive towards NW.
Current usage metrics show cumulative count of Article Views (full-text article views including HTML views, PDF and ePub downloads, according to the available data) and Abstracts Views on Vision4Press platform.
Data correspond to usage on the plateform after 2015. The current usage metrics is available 48-96 hours after online publication and is updated daily on week days.
Initial download of the metrics may take a while.