Fig. 2
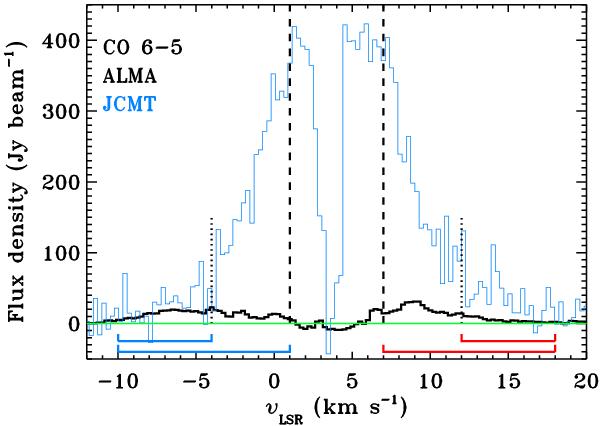
ALMA (black) and JCMT (blue) continuum-subtracted CO J = 6−5 spectra compared in the same 8′′ beam marked in Fig. 1. The dashed lines indicate the velocity interval excluded in this analysis (νsource ± 3 km s-1) and the dotted lines illustrate the high-velocity intervals less affected by filtering. The horizontal line (green) is the baseline.
Current usage metrics show cumulative count of Article Views (full-text article views including HTML views, PDF and ePub downloads, according to the available data) and Abstracts Views on Vision4Press platform.
Data correspond to usage on the plateform after 2015. The current usage metrics is available 48-96 hours after online publication and is updated daily on week days.
Initial download of the metrics may take a while.