Fig. 1
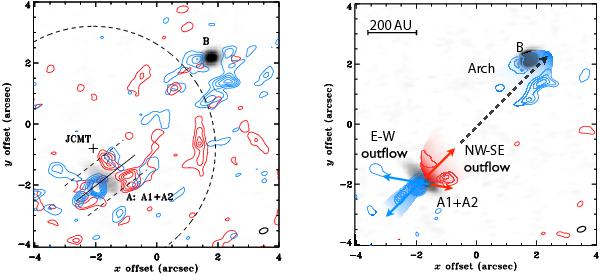
Left: map of CO J = 6−5 emission towards I16293
with contours at 6, 12, 18, ... σ of integrated intensity.
Integration limits are −10 to + 1 km s-1 and + 7
to + 18 km s-1 for the blue- and red-shifted emission, respectively. The
underlying gray-scale image shows continuum emission at 690 GHz. The positions of
sources A and B are marked; source A consists of the two sources A1 and A2. Offsets
are recorded from
16h32m22 753;
−24°28′34
753;
−24°28′34 747 (J2000).
The ALMA beam is shown in the lower right corner (black). The centre of the JCMT beam
is marked with a cross and the beam is shown as a dashed circle. The dashed lines on
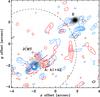
source A shows the region used to construct the pv diagram (Fig. 4). Right: the emission integrated over the highest
velocities (from −10 to −4 km s-1 and + 12 to + 18 km s-1)
is shown in contours at 5, 10, 15, ... σ. The different features are
highlighted by arrows and are labeled. The black dashed arrow is an extrapolation of
the red lobe of the NW-SE outflow.
747 (J2000).
The ALMA beam is shown in the lower right corner (black). The centre of the JCMT beam
is marked with a cross and the beam is shown as a dashed circle. The dashed lines on
source A shows the region used to construct the pv diagram (Fig. 4). Right: the emission integrated over the highest
velocities (from −10 to −4 km s-1 and + 12 to + 18 km s-1)
is shown in contours at 5, 10, 15, ... σ. The different features are
highlighted by arrows and are labeled. The black dashed arrow is an extrapolation of
the red lobe of the NW-SE outflow.
Current usage metrics show cumulative count of Article Views (full-text article views including HTML views, PDF and ePub downloads, according to the available data) and Abstracts Views on Vision4Press platform.
Data correspond to usage on the plateform after 2015. The current usage metrics is available 48-96 hours after online publication and is updated daily on week days.
Initial download of the metrics may take a while.