| Issue |
A&A
Volume 549, January 2013
|
|
|---|---|---|
| Article Number | L2 | |
| Number of page(s) | 4 | |
| Section | Letters | |
| DOI | https://doi.org/10.1051/0004-6361/201220629 | |
| Published online | 11 December 2012 | |
Rotational spectra of (162173) 1999 JU3, the target of the Hayabusa2 mission ⋆
1 Observatório Nacional, COAA, Rua Gal. José Cristino 77, 20921-400 Rio de Janeiro, Brazil
e-mail: This email address is being protected from spambots. You need JavaScript enabled to view it.
2 LESIA, Observatoire de Paris, 92195 Meudon Principal Cedex, France
3 JAXA, Sagamihara, 229-8510 Kanagawa, Japan
Received: 25 October 2012
Accepted: 22 November 2012
Abstract
Context. The Hayabusa2 mission, which will be launched by JAXA in 2014, will return samples from the C-type near-Earth asteroid (162173) 1999 JU3. To better plan the mission, it is important to obtain as many physical characteristics of the asteroid as possible from ground-based observations. Moreover, these can then be calibrated with the in-situ and laboratory studies and be used to better understand other similar objects. Regarding the surface composition of the target asteroid, previous spectroscopic studies in the visible provided conflicting results for the possible presence of a deep absorption band, which is usually related to aqueous alteration processes.
Aims. Our goal is to better understand the surface composition of asteroid (162173) 1999 JU3, and how it relates to the spectral differences observed by diverse authors at different epochs and telescopes. Moreover, to support the JAXA mission planning, we aim to constrain the level of aqueous alteration and thermal activity undergone by the object.
Methods. The adopted methodology was to observe different regions of the surface of the asteroid that rotates around its axis. Spectroscopic observations that cover about 70% of its surface were therefore obtained at the SOAR telescope in Chile on 2012 July 9−10.
Results. Our results indicate that the surface of asteroid (162173) 1999 JU3 presents featureless spectra with very little variation.
Conclusions. No sign of an absorption feature that could be related to aqueous alteration processes is detectable in the observed spectra.
Key words: minor planets, asteroids: individual: (162173) 1999 JU3 / methods: observational / techniques: spectroscopic
Based on observations performed at the SOAR telescope. The SOAR Telescope is a joint project of Conselho Nacional de Desenvolvimento Científico e Tecnológico CNPq-Brazil, The University of North Carolina at Chapel Hill, Michigan State University, and the National Optical Astronomy Observatory.
© ESO, 2012
1. Introduction
After the extraordinary success of the first asteroid sample return of Hayabusa (MUSES-C), which was launched by JAXA on May 9, 2003, and brought back to Earth samples of the S-type asteroid Itokawa after seven years (Nakamura et al. 2011), JAXA selected a second sample return mission, Hayabusa2, which is to go to the C-type near-Earth asteroid (162173) 1999 JU3 (Yoshikawa et al. 2012). The purpose of Hayabusa2 from the technological point of view is to make the system for sample return exploration more reliable and robust, and from the science point of view it is to bring back material from a primitive asteroid for a laboratory analysis. The spacecraft is similar to Hayabusa, but with many improvements to avoid the problems experienced in the first mission, and includes an impactor that creates a small crater on the surface of the asteroid. The launch window for 1999 JU3 is in 2014 (back-up window is in 2015). After an Earth swing-by in December 2015, Hayabusa2 will arrive at the asteroid in June 2018. It will stay there about one and half years. Then it will leave the asteroid in December 2019, and will return to Earth in December 2020.
Near-Earth asteroids (NEA) are representative of the population of asteroids that are considered the leftover building blocks of the solar system’s formation, which offer clues to the chemical mixture from which the planets formed some 4.6 billion years ago. In this context, studying the physical properties of a set of specific NEAs and comparing them to laboratory data of meteorites and asteroid samples obtained by space missions form the basis for a true advancement in our understanding of the origin of our solar system and on how life emerged on Earth. The NEA population, however, presents a high degree of diversity, as revealed by ground-based observations. Among the most intriguing objects are those with the most primitive compositions (Barucci et al. 2011). These objects have the most direct link to the chemistry and conditions of the early solar system and are widely believed to have preserved materials that witnessed the condensation of the early formation phases of the solar system.
The selected target of the Hayabusa2 mission, (162173) 1999 JU3, was classified as Cg-type, a subclass of the C-complex, according to the Bus taxonomy (Bus & Binzel 2002), from a visible and near-infraed (VNIR) spectrum obtained by Binzel et al. (2001) during its 1999 discovery apparition. This particular class shows a pronounced UV/blue intervalence charge-transfer (IVCT) transition absorption feature shortward 0.6 μm, a nearly flat spectrum across the 0.6 to 0.9 μm wavelength range, and sometimes a small absorption structure starting at about 0.9 μm. More recently, Vilas (2008) performed new VNIR observations of this object, using the MMT 6.5 m telescope in 2007 July and September, and the obtained spectra present significant differences among them as well as from the previous one. In particular, the July spectrum shows a deep absorption feature centered near 0.7 μm, which is usually attributed to Fe2+ → Fe3+ charge-transfer transition in oxidized iron in phyllosilicates (Vilas & Gaffey 1989) through the action of aqueous alteration processes on the asteroid surface. But because of the faintness of the object, the spectrum signal-to-noise (S/N) is quite poor (see Fig. 2 in that paper). On the other hand, the composite September spectrum, with a much higher S/N, is flat all across the range from 0.42 up to 0.9 μm, with possibly a very shallow feature ranging from 0.48 to 0.74 μm that is centered at ~0.6 μm. Finally, the UV/blue absorption observed by Binzel et al. (2001) was not present in either of the 2007 spectra.
Taken collectively, the spectra of (162173) 1999 JU3 indicate a possibly variegated surface composition. Considering that the rotational period of the asteroid has now been determined to be 7.63 ± 0.01 h (Muller et al. 2011), it is possible to asses the different regions of the asteroid surface and better understand the degree of aqueous alteration that took place. Taking advantage of the last favorable opposition before the launch of the JAXA mission, the asteroid was observed from the southern hemisphere in July 2012. Below we describe the observations and reduction process. The spectral analysis is given in Sect. 3 along with a discussion on our findings. These are then briefly summarized in the last section.
2. Observations and data reduction
Visible spectra of asteroid (162173) 1999 JU3 were acquired with the Goodman Spectrograph at the Southern Astrophysical Research (SOAR) Telescope, a 4.1-m aperture telescope on Cerro Pachón, Chile. The set-up was defined by a 1.68′′ slit, a blocking filter GG-385, a grating with 300 l/mm, and a HeAr lamp. This configuration gives a spectrum ranging from 0.4 to 0.85 μm. Observations of the asteroid and two analog stars, HD147284 and HD147935, were made in service mode during the night 09 − 10 of July of 2012, under almost photometric conditions. Both the asteroid and the analog stars were observed at several airmasses. The observational parameters are given in Table 1 where we provide the date of observation, the UT start, the exposure time, the mean air mass, and the solar analog used in the reduction for each spectrum. At the time of our observations the asteroid visual magnitude and solar phase angle were 19.9 and 33.0°.
Observational parameters for (162173) 1999 JU3.
The data were reduced with the IRAF and MIDAS packages for comparison reasons. Science targets were reduced following the standard procedures of flat-field correction and sky subtraction. The wavelength calibration was established by identifying the emission lines of HeAr lamp. The same procedures were performed for the observed solar analog stars, which show a very similar behavior. The asteroid spectra were then divided by the solar analog spectra with an air mass closer to that of the target asteroid.
Individual spectra taken close in time were summed to increase the S/N and resulted in three combined final spectra. The reflectance spectra were normalized to unity at 0.55 μm and are given in Fig. 1, where they have been offset for clarity. The first spectrum (the bottom one in the figure) combines three individual spectra, the second and third combine two. The quality of the data is good, even if we cannot exclude that the pronunced UV turndonw in this composite spectrum is the result of differential atmospheric refraction caused by problems with the slit orientation; but this effect should, in principle, be small due to the large slit used and the relatively small airmass during these particular observations.
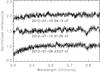 |
Fig. 1 Spectra obtained at different rotational phases. Assuming that the first one (bottom) was taken at phase zero, the others were taken at phases 0.2 and 0.6. The spectra have been normalized at 0.55 μm and are offset by 0.5 for clarity. |
At present it is not clear if the structures appearing at about 0.8 μm are real or just instrumental artifacts. The SOAR telescope is better optimized in the blue region, and there is a strong contamination (fringing) at the red-end of the spectrum that is not always adequately removed. On the other hand, if the small absorption bands are real, they may be associated to some degree of heterogeneous metamorphism.
3. Data analysis
The data show a featureless, C-type-like spectrum, with no indication of aqueous alteration absorption bands. The three spectra, obtained in intervals of about 2 h are quite similar. The first spectrum and the last present a small bending in the blue region, starting at about 0.55 μm. This does not appear to be an artifact of the observation/reduction, although, as mentioned above, we cannot exclude this possibility, and division by the other solar analog gives a similar result. Moreover, this turndown is very similar to the one present in the spectrum obtained by Binzel et al. (2001), from which the Cg-type classification was derived. This bending can be caused by the onset of a pronounced UV/blue IVCT transition absorption feature shortward of 0.6 μm, which is observed in some regions of the asteroid’s surface.
The data cover nearly 70% of (162173) 1999 JU3ťs surface since its rotational period is 7.64 h (Muller et al. 2011) and our observations cover five and half hours. If we assume that the first observation was made at zero rotational phase, the other two started at about 0.2 and 0.6. This guarantees that the obtained spectra span both hemispheres of the asteroid’s surface, which appears to be quite uniform. If there is a specific region where the surface composition was modified by aqueous alteration, an absorption band should be present in at least one of the spectra. Since this is not the case, our observations rule out its presence, at least at the latitude of our observations.
Interestingly, the spectral broad feature around 0.6 − 0.7 μm, which is usually attributed to aqueous alteration process, was reported only once on 1999 JU3. The feature is visible in a spectrum obtained in July 2007 (Vilas 2008) but under poor seeing conditions, as clearly demonstrated by the quite noisy spectrum. To investigate in more detail if this could be due to different visibility conditions, we compiled the observational circumstances for the reported observations, in particular, from Binzel et al. (2001), from Vilas (2008), and the present work. In Table 2 we give the solar phase angle, the visible magnitude, and the aspect angle for each date. The aspect angle was computed using the asteroid’s pole coordinates λecl = 73° and βecl = −62° as derived by Muller (2011). Evidently, although the solar phase varied from nearly oppositional in May 1999 to nearly 40° in July 2007, the asteroid aspect angle was almost the same during all observations. Moreover, the present data were obtained at almost the same observational configuration as those in July 2007, when the aqueously alteration feature was reported by Vilas (2008).
Visible configurations at the time of the different observations of (162173) 1999 JU3.
However, it must be mentioned that the pole determination by Muller (2011) has large uncertainties and previous solutions (Abe et al. 2008) indicated a prograde rotation with λecl = 331° and βecl = +20°. Using these values, the aspect angles of the diverse observations would change, in particular, to ~26° and 60° for the July 2007 and 2012 observations, respectively. This would imply that the observations sampled different regions of the asteroid’s surface. Moreover, the July and September 2007 observations would be at very similar aspect angle, ~26° and 20°, but at quite a different solar phase angle. Therefore, regarding the presence/absence of the ~0.7 μm band, two hypotheses are possible: the band reported in July 2007 was a spurious feature attributable to poor observational conditions and/or technical problems, or the visible configurations were different, thus, probing different regions on the asteroid’s surface.
To additionally verify the presence of small absorption bands and to quantify variations among the three spectra, we used the procedure proposed by Vilas et al. (1994) and removed the linear continuum. The continuum was computed as a linear fit to each spectrum in the region between 0.55 and 0.85 μm (Carvano et al. 2003). The resulting spectra are shown in Fig. 2, along with a polynomial fit (continuous line) to each one of them. No small absorption bands are visible, the only noticeable differences among the three spectra is in the UV region, with a more or less deep turndown.
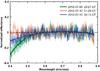 |
Fig. 2 Obtained spectra after removing the linear continuum defined by a least-squares fit to the 0.55 − 0.85 μm wavelength range. The solid thick lines represent a polynomial fit to each spectrum, clearly showing that in the region around 0.7 μm the three spectra align on the same line, which is flat and has no absorption features. |
This UV turndown is common in asteroids whose taxonomy is associated to carbonaceous chondrites, and is particularly pronounced in the Tholen G and F classes (Tholen & Barucci 1989) or Cg in the Bus-DeMeo system (Bus & Binzel 2002; DeMeo et al. 2009). It is noteworthy that this UV absorption band was also observed by Binzel et al. (2001), giving rise to the asteroid’s classification as Cg. This structure has been associated to an IVCT transition absorption feature with a minimum shortward 0.3 μm, as found in some carbonaceous chondrite meteorites, in particular CI and CM, although with much stronger strengths. The difference among the band strengths has been suggested to be the result of some degree of thermal heterogeneous metamorphism on the asteroids surfaces (Hiroi et al. 1993, 1996). More recent studies (Cloutis et al. 2011, 2012) on the characterization of carbonaceous chondrites and thermally metamorphosed meteorites revealed a much more complex scenario and the need of high-resolution asteroid spectra to be able to constrain the link between specific asteroids and meteorites.
4. Results and discussion
New reflectance spectra of NEA (162173) 1999 JU3, the target of the Hayabusa2 space mission, indicate an almost uniform C-type like surface, without strong absorption features in the 0.4 − 8.4 μm wavelength range in about 70% of the observed surface. The main results of the present work can be summarized in four points.
-
1.
Asteroid (162173) 1999 JU3 presents a featureless C-type-likespectrum in the visible region.
-
2.
No aqueous alteration absorption band was observed at any of the sampled regions.
-
3.
Spectra obtained at several instants during one night, i.e., sampling different regions of the asteroid’s surface, indicate an almost uniform composition with just small variations.
-
4.
The observed small variations, if real, are linked to the possible presence of a UV turndown, which can be tentatively related to some degree of heterogeneous thermal metamorphism.
Recently, Vilas (2012) reported new observations of the object that seem to confirm some degree of variability on the surface of 163173 (1999 JU3), although no absorption band was observed. This result was also confirmed by Sugita et al. (2012) and Moskovitz et al. (2012) who observed the asteroid in June and July 2012 and found no indication of an absorption band in their spectra. Despite the lack of hydration bands in the spectra of 162173 (1999 JU3), the link with primitive carbonaceous chondrites is supported by the flat spectrum and the low albedo of about 0.07 obtained by three different authors (Hasegawa et al. 2008; Campins et al. 2009; Muller et al. 2011). Since the asteroid is now becoming too faint for reliable ground-based observations, we will need to wait for the Hayabusa2 space mission to arrive at the asteroid in 2020 to obtain better insight into the possible presence of compositional variations on its surface. These observations, followed by the laboratory study of the returned samples, will be essential for our remote-sensing future modeling.
Acknowledgments
The authors are grateful to the director of the Laboratório Nacional de Astrofísica, Bruno Castilho, for approving the present observations under the Tempo de Diretor (Director’s discretionary time), as well as to Alberto Ardila and the SOAR staff responsible for the observations. Humberto Campins is acknowledged for his comments to improve the manuscript. CNPq, FAPERJ and CAPES are acknowledged for diverse grants and fellowships to D.L., J.M.C., and F.L.J., in particular CNPq for the Estágio Senior to D.L. and M.A.B. acknowledges the funding of the French national space agency Centre National d’Etudes Spatiales (CNES). Data used in the present paper was obtained under Program ID: SO2012A-030.
References
- Abe, M., Kawakami, K., Hasegawa, S., et al. 2008, COSPAR Scientific Assembly, B04-0061-08 [Google Scholar]
- Barucci, M. A., Dotto, E., & Levasseur-Regourd, A. C. 2011, A&ARv, 19, 48 [NASA ADS] [CrossRef] [Google Scholar]
- Binzel, R. P., Harris, A. W., Bus, S. J., et al. 2001, Icarus, 151, 139 [NASA ADS] [CrossRef] [Google Scholar]
- Bus, S. J., & Binzel, R. P. 2002, Icarus, 158, 146 [NASA ADS] [CrossRef] [Google Scholar]
- Campins, H., Emery, J. P., Kelley, M., et al. 2009, A&A, 503, L17 [NASA ADS] [CrossRef] [EDP Sciences] [Google Scholar]
- Carvano, J. M., Mothé-Diniz, T., & Lazzaro, D. 2003, Icarus, 161, 356 [NASA ADS] [CrossRef] [Google Scholar]
- Cloutis, E. A., Hiroi, T., Gaffey, M. J., et al. 2011 Icarus, 216, 309 [Google Scholar]
- Cloutis, E. A., Hudon, P., Hiroi, T., et al. 2012 Icarus, 220, 586 [Google Scholar]
- DeMeo, F. E., Binzel, R. P., Slivan, S. M., et al. 2009, Icarus, 202, 150 [Google Scholar]
- Hasegawa, S., Muller, T. G., Kawakami, K., et al. 2008, PASJ, 60, 399 [Google Scholar]
- Hiroi, T., Pieters, C. M., Zolensky, M. E., et al. 1993, Science, 261, 1016 [NASA ADS] [CrossRef] [Google Scholar]
- Hiroi, T., Zolensky, M. E., Pieters, C. M., et al. 1996, Meteor. Planet. Sci., 31, 321 [NASA ADS] [CrossRef] [Google Scholar]
- Moskovitz, N., Abe, S., Osip, D., et al. 2012, Am. Astron. Soc., DPS 44, 102.04 [Google Scholar]
- Muller, T. G., Durech, J., Hasegawa, S., et al. 2011, A&A, 525, A145 [NASA ADS] [CrossRef] [EDP Sciences] [Google Scholar]
- Nakamura, T., Noguchi, T., Masahiko, T., et al. 2011, Science, 333, 1113 [NASA ADS] [CrossRef] [Google Scholar]
- Sugita, S., Kuroda, S., Kameda, S., et al. 2012, Am. Astron. Soc., DPS 44, 102.02 [Google Scholar]
- Tholen, D., & Barucci, M. A. 1989, in Asteroids II, edn. R. P. Binzel, T. Gehrels, & M. S. Matthews (Univ. of Arizona Press), 298 [Google Scholar]
- Vilas, F. 2008, AJ, 135, 1101 [NASA ADS] [CrossRef] [Google Scholar]
- Vilas, F. 2012, Am. Astron. Soc., DPS 44, 102.03 [Google Scholar]
- Vilas, F., & Gaffey, M. J. 1989, Science, 246, 790 [NASA ADS] [CrossRef] [PubMed] [Google Scholar]
- Vilas, F., Jarvis, K. S., & Gaffey, M. J. 1994, Icarus, 109, 274 [NASA ADS] [CrossRef] [Google Scholar]
- Yoshikawa, M., Minamino, H., Tuda, Y., et al. 2012, LPICo 1667, 6188 [Google Scholar]
All Tables
Visible configurations at the time of the different observations of (162173) 1999 JU3.
All Figures
|
Fig. 1 Spectra obtained at different rotational phases. Assuming that the first one (bottom) was taken at phase zero, the others were taken at phases 0.2 and 0.6. The spectra have been normalized at 0.55 μm and are offset by 0.5 for clarity. |
| In the text | |
|
Fig. 2 Obtained spectra after removing the linear continuum defined by a least-squares fit to the 0.55 − 0.85 μm wavelength range. The solid thick lines represent a polynomial fit to each spectrum, clearly showing that in the region around 0.7 μm the three spectra align on the same line, which is flat and has no absorption features. |
| In the text | |
Current usage metrics show cumulative count of Article Views (full-text article views including HTML views, PDF and ePub downloads, according to the available data) and Abstracts Views on Vision4Press platform.
Data correspond to usage on the plateform after 2015. The current usage metrics is available 48-96 hours after online publication and is updated daily on week days.
Initial download of the metrics may take a while.