Fig. 4
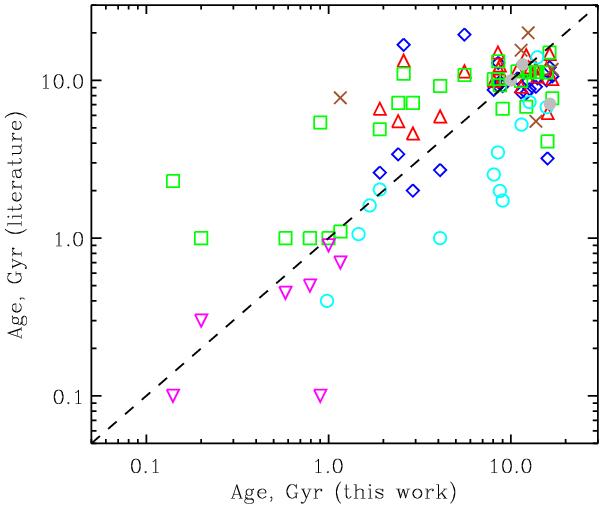
Comparison between our derived ages and those published in literature for GCs in M 31. Each coloured-symbol correspond to a different literature work, following Table 5: (a) blue diamond correspond to results by Beasley et al. (2005) (models by Bruzual & Charlot 2003); (b) red upward triangles to Beasley et al. (2005) (models by Thomas et al. 2003, 2004); (c) green squares to Puzia et al. (2005); (d) brown crosses to Fan et al. (2006); (e) magenta downward triangles to Beasley et al. (2004); (f) cyan open circles to Wang et al. (2010), and; (g) grey filled circles to Alves-Brito et al. (2009). As labeled in Table 5, references (a–c) and (e) present the results based on photometric measurements, while references (d), (f) and (g) above present the results based on spectral indices. (This figure is available in color in the electronic form.)
Current usage metrics show cumulative count of Article Views (full-text article views including HTML views, PDF and ePub downloads, according to the available data) and Abstracts Views on Vision4Press platform.
Data correspond to usage on the plateform after 2015. The current usage metrics is available 48-96 hours after online publication and is updated daily on week days.
Initial download of the metrics may take a while.