Fig. 2
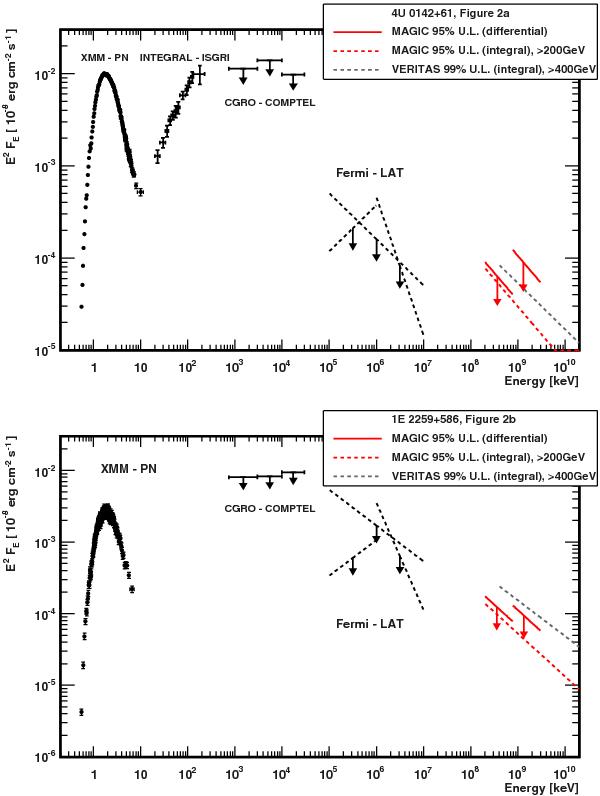
Spectral energy distributions of 4U 0142+61 a) and 1E 2259+586; b) from X-rays to TeV energies. In black the points and upper limits in the keV up to the GeV energy range are shown. The upper limits derived by the VERITAS Collaboration are shown in gray and the upper limits from this work are shown in red. See text for further details on the data and upper limits presented here.
Current usage metrics show cumulative count of Article Views (full-text article views including HTML views, PDF and ePub downloads, according to the available data) and Abstracts Views on Vision4Press platform.
Data correspond to usage on the plateform after 2015. The current usage metrics is available 48-96 hours after online publication and is updated daily on week days.
Initial download of the metrics may take a while.