Free Access
Fig. 1
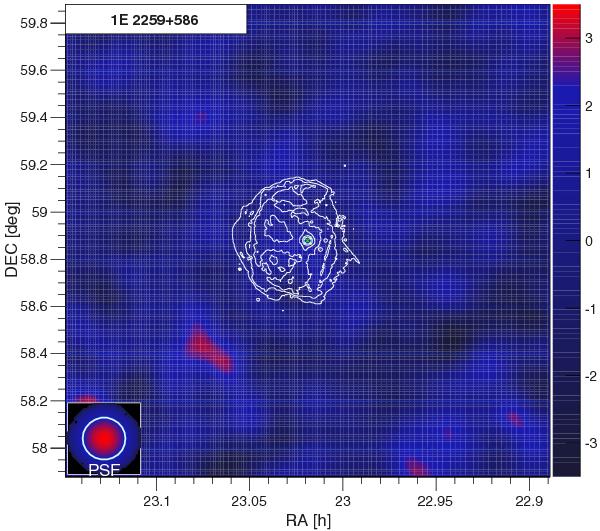
TS map of 1E 2259+586. The green cross represents the magnetar position. The white contours show the X-ray emission of the surrounding SNR CTB 109 detected with the XMM-Newton satellite. The color scale represents the TS value.
Current usage metrics show cumulative count of Article Views (full-text article views including HTML views, PDF and ePub downloads, according to the available data) and Abstracts Views on Vision4Press platform.
Data correspond to usage on the plateform after 2015. The current usage metrics is available 48-96 hours after online publication and is updated daily on week days.
Initial download of the metrics may take a while.