Fig. 3
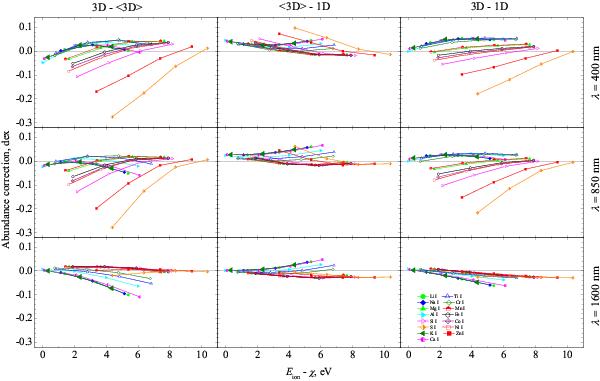
Abundance corrections for spectral lines of neutral atoms, plotted versus the difference between their ionization energy and line excitation potential, Eion − χ. Three types of abundance corrections are shown: Δ3D − ⟨ 3D ⟩ (left column), Δ ⟨ 3D ⟩ − 1D (middle column), and Δ3D − 1D (right column). Abundance corrections are provided at three different wavelengths: 400 nm (top row), 850 nm (middle row), and 1600 nm (bottom row). The ionization energies of neutral atoms used in plotting this figure are provided in Table 1.
Current usage metrics show cumulative count of Article Views (full-text article views including HTML views, PDF and ePub downloads, according to the available data) and Abstracts Views on Vision4Press platform.
Data correspond to usage on the plateform after 2015. The current usage metrics is available 48-96 hours after online publication and is updated daily on week days.
Initial download of the metrics may take a while.