Fig. 9
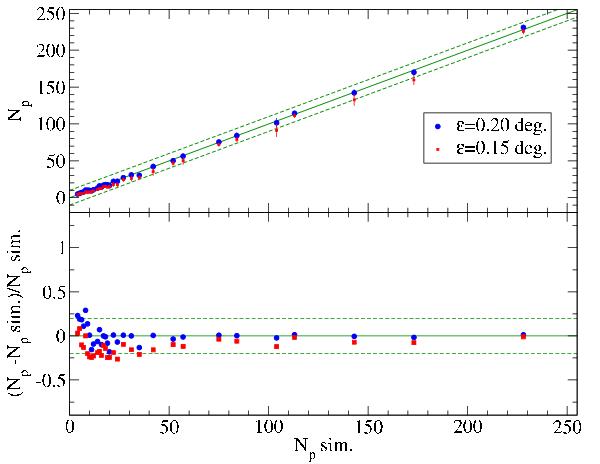
Top panel: the average number of photons associated to each clusters Np, and their dispersion (vertical bar) vs. the number of photons simulated (Np sim). The red points refer to the sub parameter space ε = 0.15 deg, and the solid blue circles to the ε = 0.20 deg subspace. The solid green lines represent the law Np = Np sim. The dashed lines represent the law Np = Np sim. ± 10. Bottom panel: the corresponding fractional deviation (Np − Npsim.)/Npsim.
Current usage metrics show cumulative count of Article Views (full-text article views including HTML views, PDF and ePub downloads, according to the available data) and Abstracts Views on Vision4Press platform.
Data correspond to usage on the plateform after 2015. The current usage metrics is available 48-96 hours after online publication and is updated daily on week days.
Initial download of the metrics may take a while.