Fig. 8
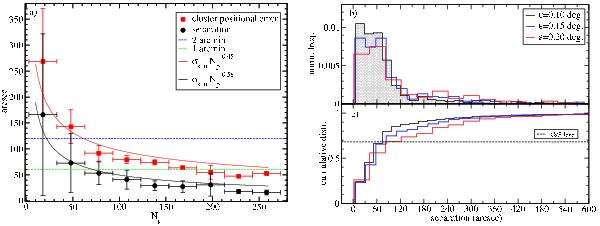
Panel a) red solid boxes show the mean positional error of the centroid for true clusters in sky test field 1 and the standard deviation (vertical error bar) vs. Np. The clusters are binned in Np, with the bin width indicated by the horizontal error bar. The black solid circles represent the corresponding trend for the distance between the cluster centroid and the simulated source position.Panel b) the distribution of the distance between the simulated source position and the cluster centroid, expressed in arcsec, for ε = 0.10 deg (black line), ε = 0.15 deg (blue line), and ε = 0.20 deg (red lines). Panel c) the cumulative distributions corresponding to panel b).
Current usage metrics show cumulative count of Article Views (full-text article views including HTML views, PDF and ePub downloads, according to the available data) and Abstracts Views on Vision4Press platform.
Data correspond to usage on the plateform after 2015. The current usage metrics is available 48-96 hours after online publication and is updated daily on week days.
Initial download of the metrics may take a while.