Fig. 6
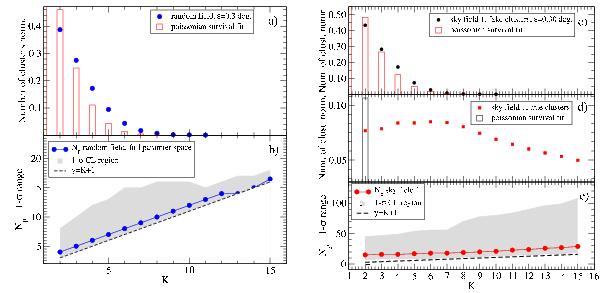
Panel b) the Np statistical distribution as a function of K for the random field case. The blue solid circles represent the median and the gray shaded area represents the 1-σ confidence level region around the median for each value of K. The dashed black line represents the Np = K + 1 law. Panel e) same as in panel b) for the sky test field 1 case. Panel a) number of detected clusters for the random test field case (blue solid points) as a function of K, and best fit by means of a Poissonian survival function (red empty bars). Panel c) number of detected cluster for the sky test field 1 case (black solid points), for the fake clusters as a function of K, and best fit by means of a Poissonian survival function (red empty bars). Panel d) number of detected cluster for the sky test field 1 case (red solid boxes) for the true clusters as a function of K, and best fit by means of a Poissonian survival function (black empty boxes).
Current usage metrics show cumulative count of Article Views (full-text article views including HTML views, PDF and ePub downloads, according to the available data) and Abstracts Views on Vision4Press platform.
Data correspond to usage on the plateform after 2015. The current usage metrics is available 48-96 hours after online publication and is updated daily on week days.
Initial download of the metrics may take a while.