Fig. 5
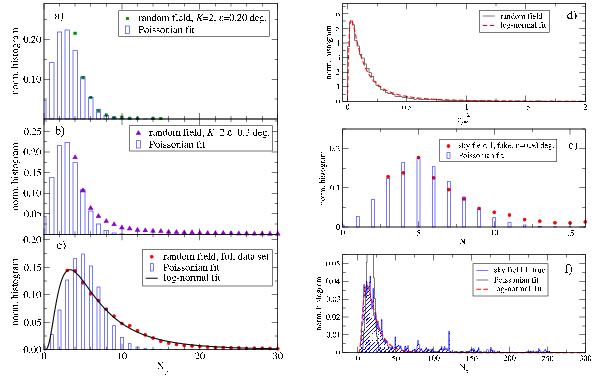
Left panels: the distribution of
Np for the random
test field for K = 2, ε = 0.20 deg (panel
a), red solid boxes). The empty blue bar line represents a Poissonian
best fit. Panel b) shows K = 2
ε = 0.30 deg (purple solid triangles). Panel c) shows
the full K-ε parameter space, the solid black line
represent a log-normal best fit. Right panels: panel c)
shows the distribution of  (black
solid line), and its best fit by means of a log-normal distribution (red dashed
line). Panel d) shows the
Np distribution for the fake
clusters in the sky test field 1 (red solid circles), and
the blue empty bars show a Poissonian best fit. Panel e) shows the
Np distribution for the fake
clusters in the sky test field 1 (blue hatched histogram),
the log-normal best fit (red dashed line), and the Poissonian fit (solid black
line).
(black
solid line), and its best fit by means of a log-normal distribution (red dashed
line). Panel d) shows the
Np distribution for the fake
clusters in the sky test field 1 (red solid circles), and
the blue empty bars show a Poissonian best fit. Panel e) shows the
Np distribution for the fake
clusters in the sky test field 1 (blue hatched histogram),
the log-normal best fit (red dashed line), and the Poissonian fit (solid black
line).
Current usage metrics show cumulative count of Article Views (full-text article views including HTML views, PDF and ePub downloads, according to the available data) and Abstracts Views on Vision4Press platform.
Data correspond to usage on the plateform after 2015. The current usage metrics is available 48-96 hours after online publication and is updated daily on week days.
Initial download of the metrics may take a while.