Fig. 4
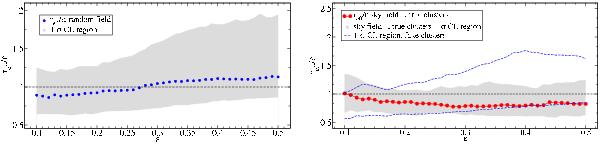
Left panel: the reff/ε statistical distribution as a function of ε for the random field case. The blue solid circles represent the median, and the gray shaded area represents the 1-σ confidence level region, for each value of ε. Right panel: the same as in the bottom left panel for the sky test field 1. The red solid circles represent the median of the true clusters case, and the grey area the 1-σ confidence level region. The dashed line shows the 1-σ confidence level region, for the fake clusters.
Current usage metrics show cumulative count of Article Views (full-text article views including HTML views, PDF and ePub downloads, according to the available data) and Abstracts Views on Vision4Press platform.
Data correspond to usage on the plateform after 2015. The current usage metrics is available 48-96 hours after online publication and is updated daily on week days.
Initial download of the metrics may take a while.