Fig. 2
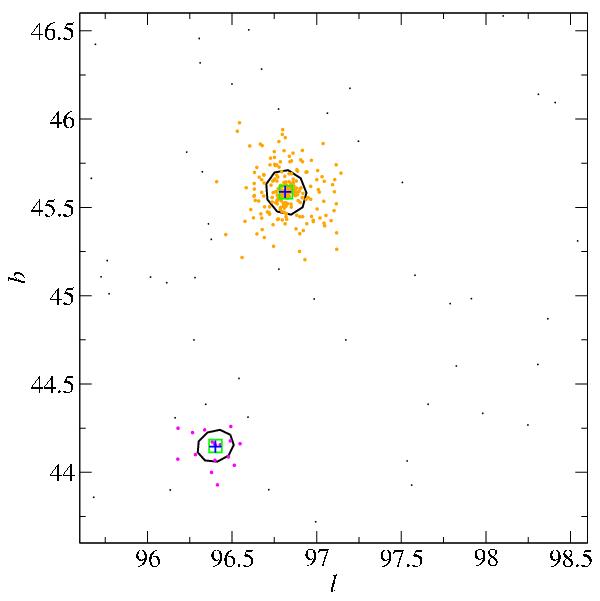
Close-up of two true clusters reported in Fig. 1. The ellipses correspond to the ellipse of the cluster containment. The purple and orange points represent the cluster points, the black dots represent the background events, the blue crosses the position of the simulated sources, and green boxes the position of the cluster centroid.
Current usage metrics show cumulative count of Article Views (full-text article views including HTML views, PDF and ePub downloads, according to the available data) and Abstracts Views on Vision4Press platform.
Data correspond to usage on the plateform after 2015. The current usage metrics is available 48-96 hours after online publication and is updated daily on week days.
Initial download of the metrics may take a while.